

Electrification
Interactive: EV Charging Stations Across the U.S. Mapped

Electric Vehicle Charging Stations Across America: Mapped
As the electric vehicle market continues to expand, having enough EV charging stations is essential to enable longer driving ranges and lower wait times at chargers.
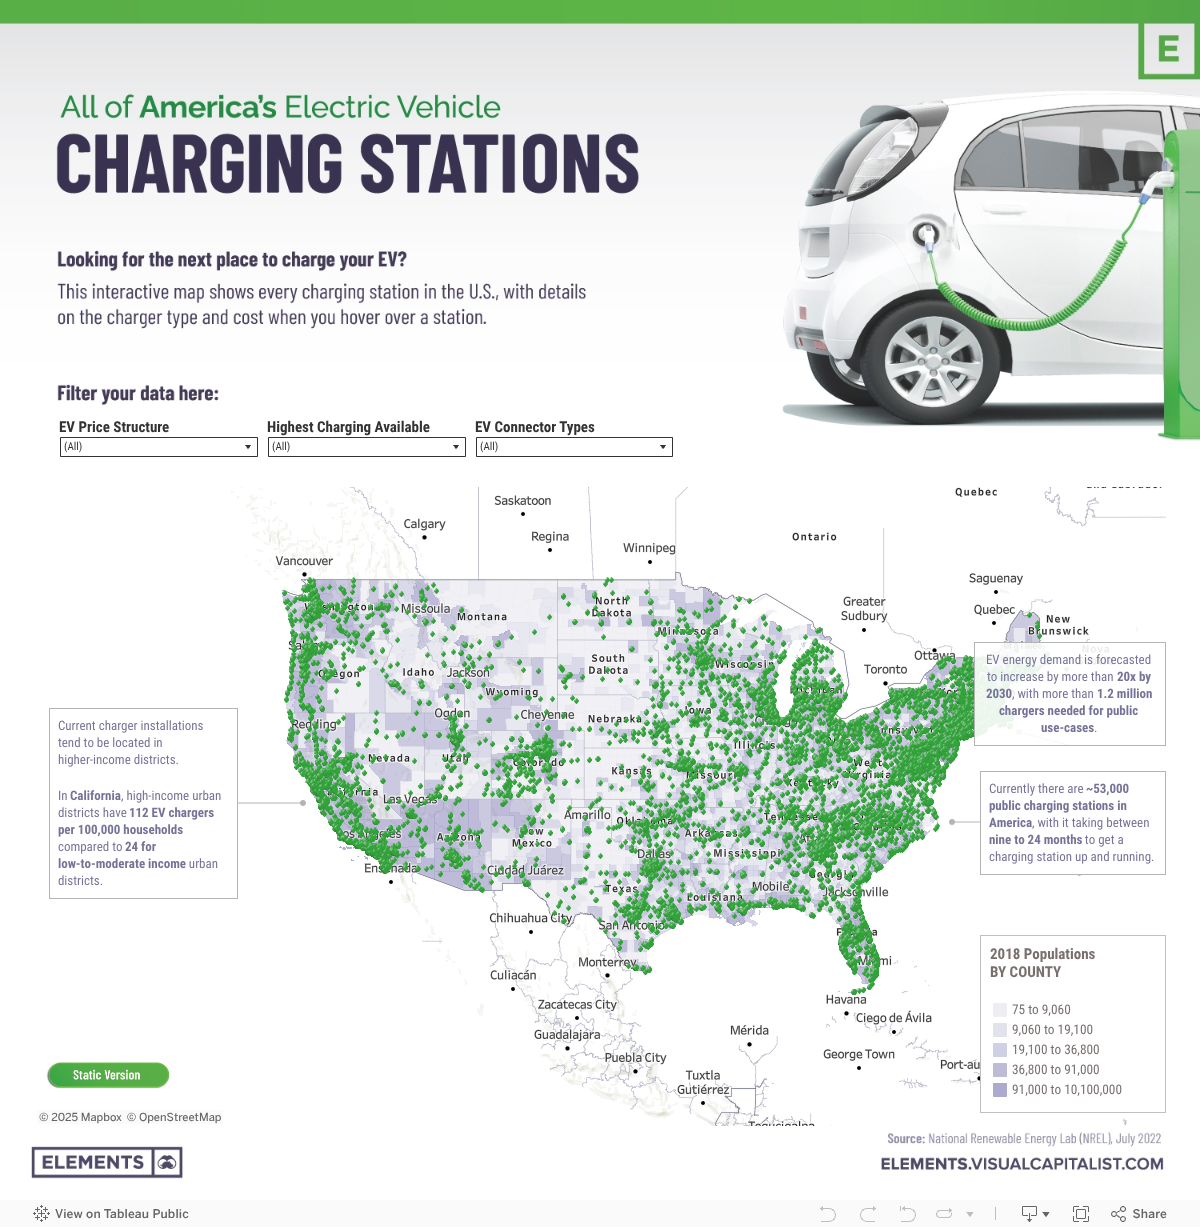
Currently, the U.S. has about 140,000 public EV chargers distributed across almost 53,000 charging stations, which are still far outnumbered by the 145,000 gas fueling stations in the country.
This graphic maps out EV charging stations across the U.S. using data from the National Renewable Energy Lab. The map has interactive features when viewed on desktop, showing pricing structures and the connector types when hovering over a charging station, along with filtering options.
Which States Lead in EV Charging Infrastructure?
As seen in the map above, most electric vehicle charging stations in the U.S. are located on the west and east coasts of the nation, while the Midwest strip is fairly barren aside from the state of Colorado.
California has the highest number of EV charging stations at 15,182, making up an impressive 29% of all charging stations in America. In fact, the Golden State has nearly double the chargers of the following three states, New York (3,085), Florida (2,858), and Texas (2,419) combined.
| Rank | State | Number of charging stations | Share of U.S. charging stations |
|---|---|---|---|
| 1 | California | 15,182 | 28.7% |
| 2 | New York | 3,085 | 5.8% |
| 3 | Florida | 2,858 | 5.4% |
| 4 | Texas | 2,419 | 4.6% |
| 5 | Massachusetts | 2,328 | 4.4% |
| 6 | Washington | 1,810 | 3.4% |
| 7 | Colorado | 1,718 | 3.2% |
| 8 | Georgia | 1,596 | 3.0% |
| 9 | Maryland | 1,358 | 2.6% |
| 10 | Pennsylvania | 1,260 | 2.4% |
| U.S. Total | 52,889 | 100.0% |
It’s no surprise the four top states by GDP have the highest number of EV chargers, and California’s significant lead is also unsurprising considering its ambition to completely phase out the sale of new gas vehicles by 2035.
The Best States for EV Charging Speeds and Cost
While having many charging stations distributed across a state is important, two other factors determine charging convenience: cost and charger level availability.
EV charger pricing structures and charger level availability across the nation are a Wild West with no set rules and few clear expectations.
Finding Free Electric Vehicle Chargers Across States
Generous electric vehicle charging locations will offer unlimited free charging or a time cap between 30 minutes and 4 hours of free charging before payment is required. Some EV charging stations located in parking structures simply require a parking fee, while others might have a flat charging fee per session, charge by kWh consumed, or have an hourly rate.
While California leads in terms of the raw amount of free chargers available in the state, it’s actually the second worst in the top 10 states when it comes to the share of chargers, at only 11% of them free for 30 minutes or more.
| Rank | State name | Number of free charging stations | Share of free charging stations in the state |
|---|---|---|---|
| 1 | California | 1,717 | 11.3% |
| 2 | Florida | 673 | 23.6% |
| 3 | New York | 662 | 21.5% |
| 4 | Texas | 606 | 25.1% |
| 5 | Maryland | 399 | 29.4% |
| 6 | Georgia | 360 | 22.6% |
| 7 | Washington | 358 | 19.8% |
| 8 | Pennsylvania | 318 | 25.2% |
| 9 | Colorado | 273 | 15.9% |
| 10 | Massachusetts | 150 | 6.4% |
| U.S. Total | 10,295 | 19.5% |
Meanwhile, Maryland leads with almost 30% of the chargers in the state that offer a minimum of 30 minutes of free charging. On the other hand, Massachusetts is the stingiest state of the top 10, with only 6% of charging stations (150 total) in the state offering free charging for electric vehicle drivers.
The States with the Best DC Fast Charger Availability
While free EV chargers are great, having access to fast chargers can matter just as much, depending on how much you value your time. Most EV drivers across the U.S. will have access to level 2 chargers, with more than 86% of charging stations in the country having level 2 chargers available.
Although level 2 charging (4-10 hours from empty to full charge) beats the snail’s pace of level 1 charging (40-50 hours from empty to full charge), between busy schedules and many charging stations that are only free for the first 30 minutes, DC fast charger availability is almost a necessity.
Direct current fast chargers can charge an electric vehicle from empty to 80% in 20-60 minutes but are only available at 12% of America’s EV charging stations today.
| Rank | State | Number of stations with DC fast charger available | Share of DC fast charger available stations in state | Share of free and DC fast charger available stations in state | |
|---|---|---|---|---|---|
| 1 | California | 1,756 | 11.6% | 0.7% | |
| 2 | Florida | 360 | 12.6% | 1.1% | |
| 3 | Texas | 276 | 11.4% | 1.2% | |
| 4 | Colorado | 243 | 14.1% | 1.1% | |
| 5 | New York | 234 | 7.6% | 0.8% | |
| 6 | Washington | 232 | 12.8% | 1.1% | |
| 7 | Georgia | 228 | 14.3% | 1.4% | |
| 8 | Maryland | 223 | 16.4% | 2.7% | |
| 9 | Pennsylvania | 134 | 10.6% | 1.0% | |
| 10 | Massachusetts | 134 | 5.8% | 0.2% | |
| U.S. Total | 6,540 | 12.4% | 0.9% |
Just like free stations, Maryland leads the top 10 states in having the highest share of DC fast chargers at 16%. While Massachusetts was the worst state for DC charger availability at 6%, the state of New York was second-worst at 8% despite its large number of chargers overall. All other states in the top 10 have DC chargers available in at least one in 10 charging stations.
As for the holy grail of charging stations, with free charging and DC fast charger availability, almost 1% of the country’s charging stations are there. So if you’re hoping for free and DC fast charging, the chances in most states are around one in 100.
The Future of America’s EV Charging Infrastructure
As America works towards Biden’s goal of having half of all new vehicles sold in 2030 be zero-emissions vehicles (battery electric, plug-in hybrid electric, or fuel cell electric), charging infrastructure across the nation is essential in improving accessibility and convenience for drivers.
The Biden administration has given early approval to 35 states’ EV infrastructure plans, granting them access to $900 million in funding as part of the $5 billion National Electric Vehicle Infrastructure (NEVI) Formula Program set to be distributed over the next five years.
Along with this program, a $2.5 billion Discretionary Grant Program aims to increase EV charging access in rural, undeserved, and overburdened communities, along with the Inflation Reduction Act’s $3 billion dedicated to supporting access to EV charging for economically disadvantaged communities.
With more than $10 billion being invested into EV charging infrastructure over the next five years and more than half the sum focused on communities with poor current access, charger availability across America is set to continue improving in the coming years.


Electrification
Ranked: The Top 10 EV Battery Manufacturers in 2023
Asia dominates this ranking of the world’s largest EV battery manufacturers in 2023.

The Top 10 EV Battery Manufacturers in 2023
This was originally posted on our Voronoi app. Download the app for free on iOS or Android and discover incredible data-driven charts from a variety of trusted sources.
Despite efforts from the U.S. and EU to secure local domestic supply, all major EV battery manufacturers remain based in Asia.
In this graphic we rank the top 10 EV battery manufacturers by total battery deployment (measured in megawatt-hours) in 2023. The data is from EV Volumes.
Chinese Dominance
Contemporary Amperex Technology Co. Limited (CATL) has swiftly risen in less than a decade to claim the title of the largest global battery group.
The Chinese company now has a 34% share of the market and supplies batteries to a range of made-in-China vehicles, including the Tesla Model Y, SAIC’s MG4/Mulan, and Li Auto models.
| Company | Country | 2023 Production (megawatt-hour) | Share of Total Production |
|---|---|---|---|
| CATL | 🇨🇳China | 242,700 | 34% |
| BYD | 🇨🇳China | 115,917 | 16% |
| LG Energy Solution | 🇰🇷Korea | 108,487 | 15% |
| Panasonic | 🇯🇵Japan | 56,560 | 8% |
| SK On | 🇰🇷Korea | 40,711 | 6% |
| Samsung SDI | 🇰🇷Korea | 35,703 | 5% |
| CALB | 🇨🇳China | 23,493 | 3% |
| Farasis Energy | 🇨🇳China | 16,527 | 2% |
| Envision AESC | 🇨🇳China | 8,342 | 1% |
| Sunwoda | 🇨🇳China | 6,979 | 1% |
| Other | - | 56,040 | 8% |
In 2023, BYD surpassed LG Energy Solution to claim second place. This was driven by demand from its own models and growth in third-party deals, including providing batteries for the made-in-Germany Tesla Model Y, Toyota bZ3, Changan UNI-V, Venucia V-Online, as well as several Haval and FAW models.
The top three battery makers (CATL, BYD, LG) collectively account for two-thirds (66%) of total battery deployment.
Once a leader in the EV battery business, Panasonic now holds the fourth position with an 8% market share, down from 9% last year. With its main client, Tesla, now effectively sourcing batteries from multiple suppliers, the Japanese battery maker seems to be losing its competitive edge in the industry.
Overall, the global EV battery market size is projected to grow from $49 billion in 2022 to $98 billion by 2029, according to Fortune Business Insights.
Electrification
White Gold: Mapping U.S. Lithium Mines
In this graphic, Visual Capitalist partnerered with EnergyX to explore the size and location of U.S. lithium mines.

White Gold: Mapping U.S. Lithium Mines
The U.S. doubled imports of lithium-ion batteries for the third consecutive year in 2022, and with EV demand growing yearly, U.S. lithium mines must ramp up production or rely on other nations for their supply of refined lithium.
To determine if the domestic U.S. lithium opportunity can meet demand, we partnered with EnergyX to determine how much lithium sits within U.S. borders.
U.S. Lithium Projects
The most crucial measure of a lithium mine’s potential is the quantity that can be extracted from the source.
For each lithium resource, the potential volume of lithium carbonate equivalent (LCE) was calculated with a ratio of one metric ton of lithium producing 5.32 metric tons of LCE. Cumulatively, existing U.S. lithium projects contain 94.8 million metric tons of LCE.
| Rank | Project Name | LCE, million metric tons (est.) |
|---|---|---|
| 1 | McDermitt Caldera | 21.5 |
| 2 | Thacker Pass | 19.1 |
| 3 | Tonopah Flats | 18.0 |
| 4 | TLC Lithium | 10.7 |
| 5 | Clayton Valley (Century Lithium) | 6.3 |
| 6 | Zeus Lithium | 6.3 |
| 7 | Rhyolite Ridge | 3.4 |
| 8 | Arkansas Smackover (Phase 1A) | 2.8 |
| 9 | Basin Project | 2.2 |
| 10 | McGee Deposit | 2.1 |
| 11 | Arkansas Smackover (South West) | 1.8 |
| 12 | Clayton Valley (Lithium-X, Pure Energy) | 0.8 |
| 13 | Big Sandy | 0.3 |
| 14 | Imperial Valley/Salton Sea | 0.3 |
U.S. Lithium Opportunities, By State
U.S. lithium projects mainly exist in western states, with comparatively minor opportunities in central or eastern states.
| State | LCE, million metric tons (est.) |
|---|---|
| Nevada | 88.2 |
| Arkansas | 4.6 |
| Arizona | 2.5 |
| California | 0.3 |
Currently, the U.S. is sitting on a wealth of lithium that it is underutilizing. For context, in 2022, the U.S. only produced about 5,000 metric tons of LCE and imported a projected 19,000 metric tons of LCE, showing that the demand for the mineral is healthy.
The Next Gold Rush?
U.S. lithium companies have the opportunity to become global leaders in lithium production and accelerate the transition to sustainable energy sources. This is particularly important as the demand for lithium is increasing every year.
EnergyX is on a mission to meet U.S. lithium demands using groundbreaking technology that can extract 300% more lithium from a source than traditional methods.
You can take advantage of this opportunity by investing in EnergyX and joining other significant players like GM in becoming a shareholder.


-

 Electrification3 years ago
Ranked: The Top 10 EV Battery Manufacturers
-

 Electrification2 years ago
The Key Minerals in an EV Battery
-

 Real Assets3 years ago
The World’s Top 10 Gold Mining Companies
-

 Misc3 years ago
All the Metals We Mined in One Visualization
-

 Electrification3 years ago
The Biggest Mining Companies in the World in 2021
-

 Energy Shift2 years ago
What Are the Five Major Types of Renewable Energy?
-

 Electrification2 years ago
Mapped: Solar Power by Country in 2021
-

 Electrification2 years ago
The World’s Largest Nickel Mining Companies