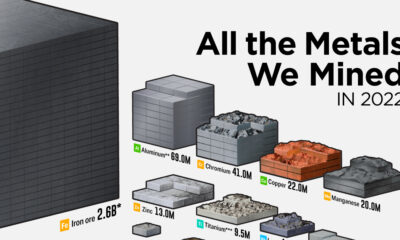

This infographic visualizes the 2.8 billion tonnes of metals mined in 2022.
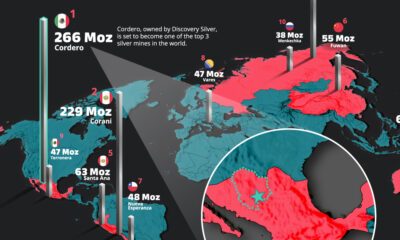

Global silver demand is poised to soar in the next decade, driven by emerging technologies like EVs and solar power.
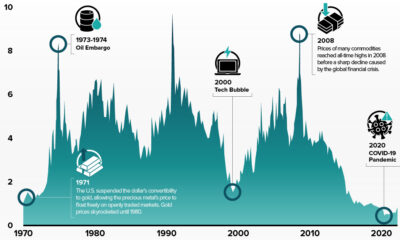

The commodities-to-equities ratio recently hit a 50-year low. In the past, when this ratio reached such levels, commodity supercycles began.
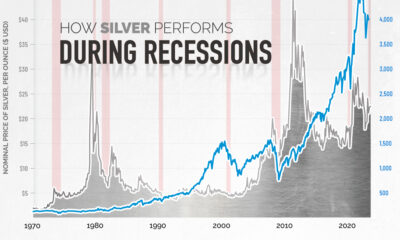

Silver is a unique precious metal that derives demand from scarcity and also industrial applications. So how has it performed during recessions?
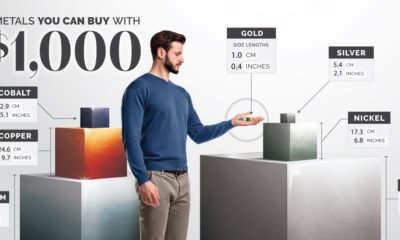

Curious how much of a metal you get for $1,000? This infographic compares the amount of precious and industrial metals worth $1,000.
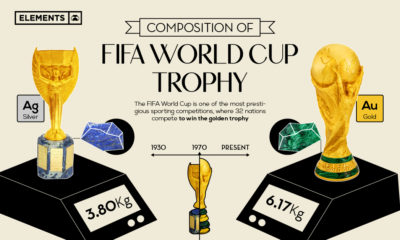

This infographic explores the history and composition of the FIFA World Cup trophy ahead of the 22nd edition of the competition.
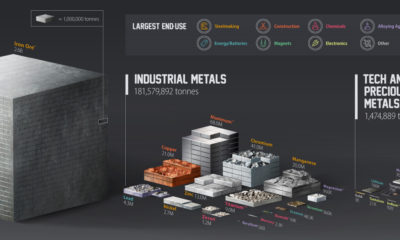

See the 2.8 billion tonnes of metals mined in 2021.
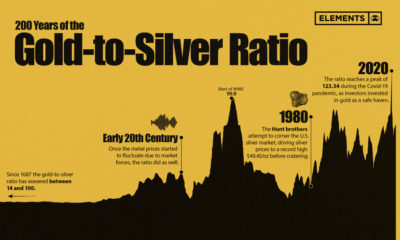

The gold-to-silver ratio used to define the value of currencies and still remains an important metric for metals investors today.
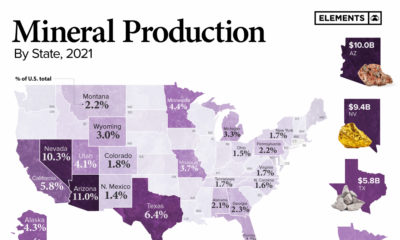

This infographic breaks down $90.4 billion in non-fuel mineral production by state.
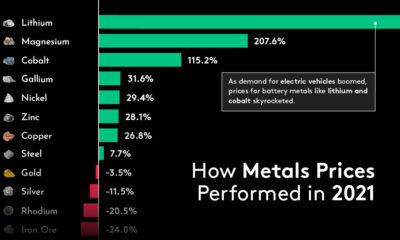

Metals mostly provided positive returns in 2021, with lithium and other industrial metals leading the charge while gold and silver slumped.