

Misc
What is the FIFA World Cup Trophy Made Of?
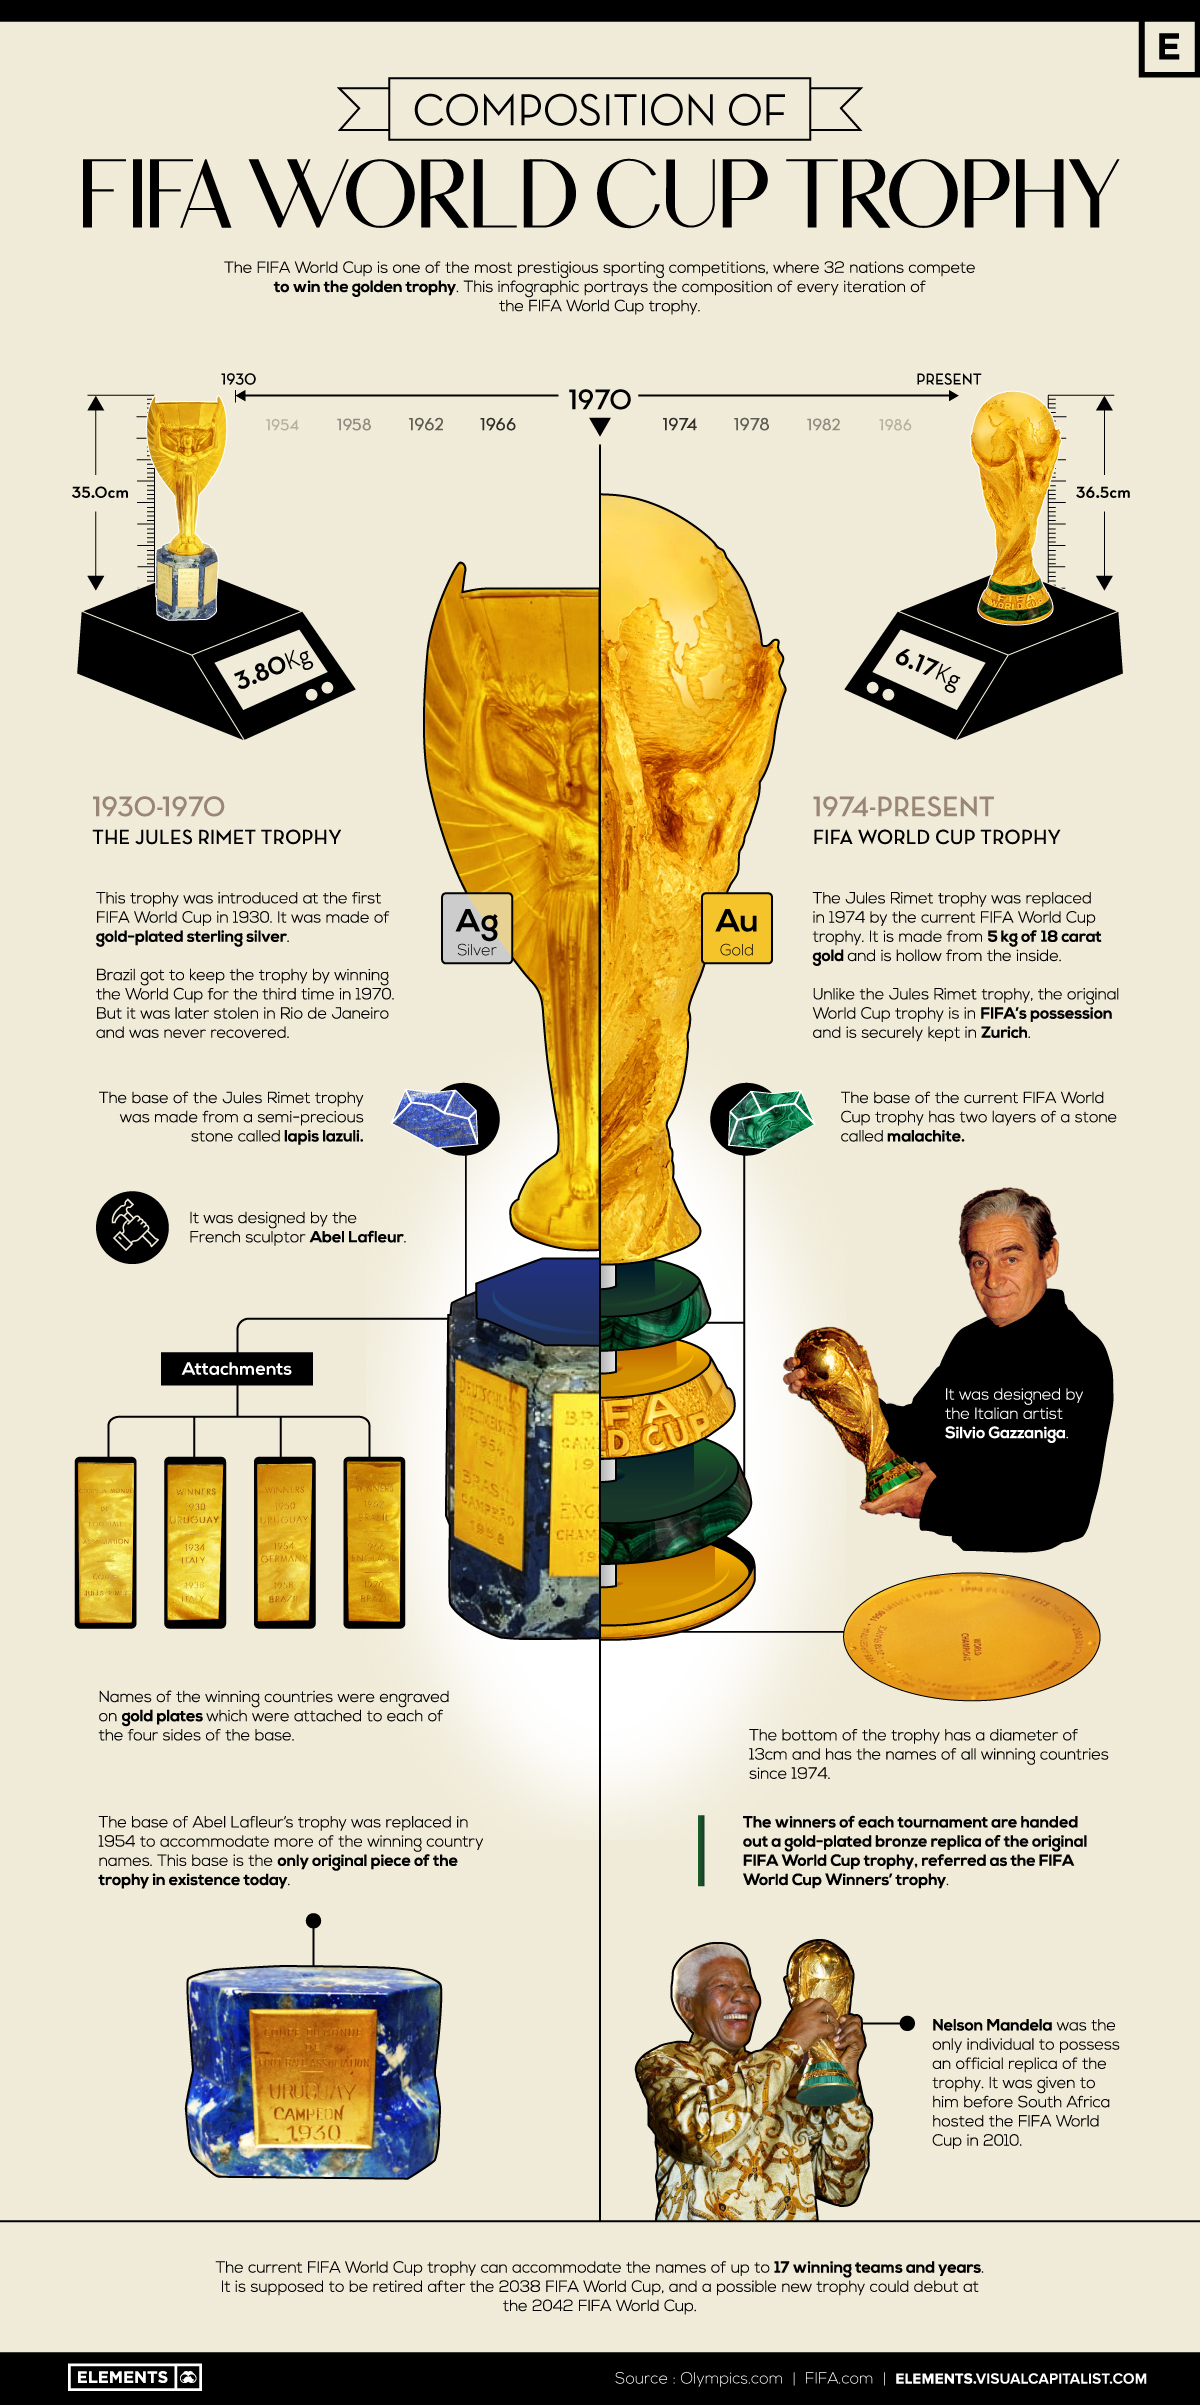
What is the FIFA World Cup Trophy Made Of?
Soccer is one of the world’s most popular sports with approximately 3.5 billion fans globally.
It was in Uruguay, in 1930, that the very first FIFA World Cup was held. It has occurred once every four years since then (except in 1942 and 1946 due to World War II).
This year, 92 years after its start, the 22nd FIFA World Cup tournament is scheduled to take place in Qatar. The highly anticipated event involves 32 national teams that will compete to win one of the most prestigious titles and a historic trophy.
So, what is the coveted FIFA World Cup trophy made up of?
The History and Composition of FIFA World Cup Trophies
Since its debut in the first FIFA World Cup tournament, in 1930, there have been two iterations of the World Cup trophy. Both trophies were made with a combination of metals and rare stones.
Until 1970, the Jules Rimet Trophy, designed by the French sculptor Abel Lafleur, glorified the winning team. A redesigned version of the trophy by Silvio Gazzaniga replaced the original in the 1974 FIFA World Cup tournament.
The Jules Rimet Trophy
Commonly called the Coupe du Monde (French for World Cup), the Jules Rimet trophy was officially renamed in 1946, honoring the then FIFA president Jules Rimet on his 25th Anniversary in office.
The trophy had a height of 35cm and weighed 3.8kg. It was made of gold-plated sterling silver and featured Nike, the Greek Goddess of Victory, holding an octagonal cup. The base of the trophy was made from a semi-precious stone called lapis lazuli. Golden plates were attached to each side of the base and they held the names of the winning teams from 1930 to 1970.
Since the beginning, it was agreed that the first team to win the World Cup three times would get to permanently keep the trophy. In 1970, Brazil marked its third victory by beating Italy in the finals and took the Jules Rimet trophy home.
However, in 1983, the trophy that even survived World War 2 was stolen from the Brazilian Football Confederation (CBF) headquarters in Rio de Janeiro and was never found. The only original piece of the Jules Rimet trophy in existence is the base that was replaced in 1954 to accommodate more winning-team names.
The FIFA World Cup Trophy
After handing over Abel Lafleur’s original trophy to Brazil in 1970, FIFA held a design competition in search of a new World Cup trophy. The association received 53 submissions from seven countries and Silvio Gazzaniga’s design of two human figures holding the Earth in their hands won the competition.
This new trophy is 36.5cm tall and weighs 6.17kg. It is made from 5kg of 18-karat gold and two layers of malachite. The base of the trophy is 13cm in diameter and the names of all winning teams since 1974 along with the years are engraved on it. This current iteration of the World Cup trophy can accommodate the names of 17 winning countries and years.
Unlike the Jules Rimet trophy, the current iteration of the trophy will not be handed over to a team definitively. It permanently belongs to the International Federation of Association Football (FIFA) and is secured at its Zurich headquarters.
However, a gold-plated bronze replica of the cup referred to as the World Cup Winners’ Trophy is given to every winning team.
Battle Royal: The 2022 FIFA World Cup
The 2022 FIFA World Cup tournament is long awaited by billions of passionate soccer fans.
It could be the final opportunity for two of the world’s best players—Cristiano Ronaldo, and Lionel Messi—to lift the World Cup trophy as they supposedly plan to retire from international games before the next World Cup.
This year, will your favorite national team be able to pose for a victory picture holding the golden trophy in their hands?


Misc
Brass Rods: The Secure Choice
This graphic shows why brass rods are the secure choice for precision-machined and forged parts.

Brass Rods: The Secure Choice
The unique combination of machinability and recyclability makes brass rods the secure choice for manufacturers seeking future-proof raw material solutions.
This infographic, from the Copper Development Association, shows three ways brass rods give manufacturers greater control and a license to grow in the competitive market for precision-machined and forged products.
Future-Proof Investments in New Machine Tools
A material’s machinability directly impacts machine throughput, which typically has the largest impact on machine shop profitability.
The high-speed machining capabilities of brass rods maximize machine tool performance, allowing manufacturers to run the material faster and longer without sacrificing tool life, chip formation, or surface quality.
The high machining efficiency of brass leads to reduced per-part costs, quicker return on investment (ROI) for new machine tools, and expanded production capacity for new projects.
Supply Security Through Closed Loop Recycling
Brass, like its parent element copper, can be infinitely recycled.
In 2022, brass- and wire-rod mills accounted for the majority of the 830,000 tonnes of copper recycled from scrap in the U.S.
Given that scrap ratios for machined parts typically range from 60-70% by weight, producing mills benefit from a secure and steady supply of clean scrap returned directly from customers, which is recycled to create new brass rods.
The high residual value of brass scrap creates a strong recycling incentive. Scrap buy back programs give manufacturers greater control over raw material net costs as scrap value is often factored into supplier purchase agreements.
Next Generation Alloys for a Lead-Free Future
Increasingly stringent global regulations continue to pressure manufacturers to minimize the use of materials containing trace amounts of lead and other harmful impurities.
The latest generation of brass-rod alloys is engineered to meet the most demanding criteria for lead leaching in drinking water and other sensitive applications.
Seven brass-rod alloys passed rigorous testing to become the only ‘Acceptable Materials’ against lower lead leaching criteria recently adopted in the national U.S. drinking water quality standard, NSF 61.
Learn more about the advantages of brass rods solutions.
Misc
Brass Rods: The Safe Choice
From airbags to firefighting equipment, components made from brass rods play a vital role in creating a safer environment.

Brass Rods: The Safe Choice
From airbags to firefighting equipment, components made from brass rods play a vital role in creating a safer environment.
This infographic from the Copper Development Association illustrates three use cases for brass. This is the first of three infographics in our Choose Brass series.
Why Brass?
Brass is one of the most reliable metals for industrial and other applications. It contains little to no iron, protecting it from oxidation, which can cause other materials to fail over time.
Additionally, the malleability of brass ensures tight and leak-free metal-to-metal seals for threaded joints, minimizing the risk of costly and dangerous system failures. Brass’s durability ensures critical system components function properly for years.
Brass for Safe Water Systems
Exposure to lead in water can cause various health problems, including neurological damage, developmental delays, and cardiovascular diseases.
As a result, the U.S. sets minimum health-effect requirements for chemical contaminants and impurities indirectly transferred to drinking water from products, components, and materials used in water systems.
Currently, only brass rod alloys are designated as “acceptable materials” according to national standards.
Brass is also essential for ensuring workplace safety, particularly in high-risk manufacturing environments.
Using Brass for Safe Manufacturing and Industrial Environments
Brass is used extensively in industrial applications such as machinery components, valves, fittings, architectural elements, bearings, and gears.
The machinability of brass rods also means longer tool life and higher productivity for manufacturers of precision parts.
The microstructure of brass helps break up metal chips generated during machining operations, preventing long and stringy chips that can crash machines and seriously injure operators.
Additionally, brass’s non-sparking properties make it ideal for tooling, fittings, and components in high-risk industries such as oil & gas, chemicals, pharmaceuticals, paint manufacturing, power plants, and explosives.
Brass for Safer Communities
Many pieces of equipment in our daily lives also rely on brass rod parts to function. Control valves in gas stoves, BBQs, and home furnaces made from brass rods reduce the risk of deadly gas leaks and fires.
Moreover, brass is ideal for firefighting equipment due to its corrosion resistance, durability, heat resistance, and non-sparking properties.
Fittings made from brass rods ensure that the brakes and airbags in our vehicles work when needed.
Brass and other copper-based alloys are also naturally antimicrobial, helping prevent diseases when used in high-touch surfaces such as door handles.
These are only some of the ways that brass rods help build a safer world for everyone.
Explore the Advantages of Brass Rod Solutions.

-

 Electrification3 years ago
Ranked: The Top 10 EV Battery Manufacturers
-

 Electrification2 years ago
The Key Minerals in an EV Battery
-

 Real Assets3 years ago
The World’s Top 10 Gold Mining Companies
-

 Misc3 years ago
All the Metals We Mined in One Visualization
-

 Electrification3 years ago
The Biggest Mining Companies in the World in 2021
-

 Energy Shift2 years ago
What Are the Five Major Types of Renewable Energy?
-

 Electrification2 years ago
Mapped: Solar Power by Country in 2021
-

 Electrification2 years ago
The World’s Largest Nickel Mining Companies