

Real Assets
Charting the Gold-to-Silver Ratio Over 200 Years
Charting 200 Years of the Gold-to-Silver Ratio
Gold and silver have been precious and monetary metals for millennia, with the gold-to-silver ratio having been measured since the days of Ancient Rome.
Historically, the ratio between gold and silver played an important role in ensuring coins had their appropriate value, and it remains an important technical metric for metals investors today.
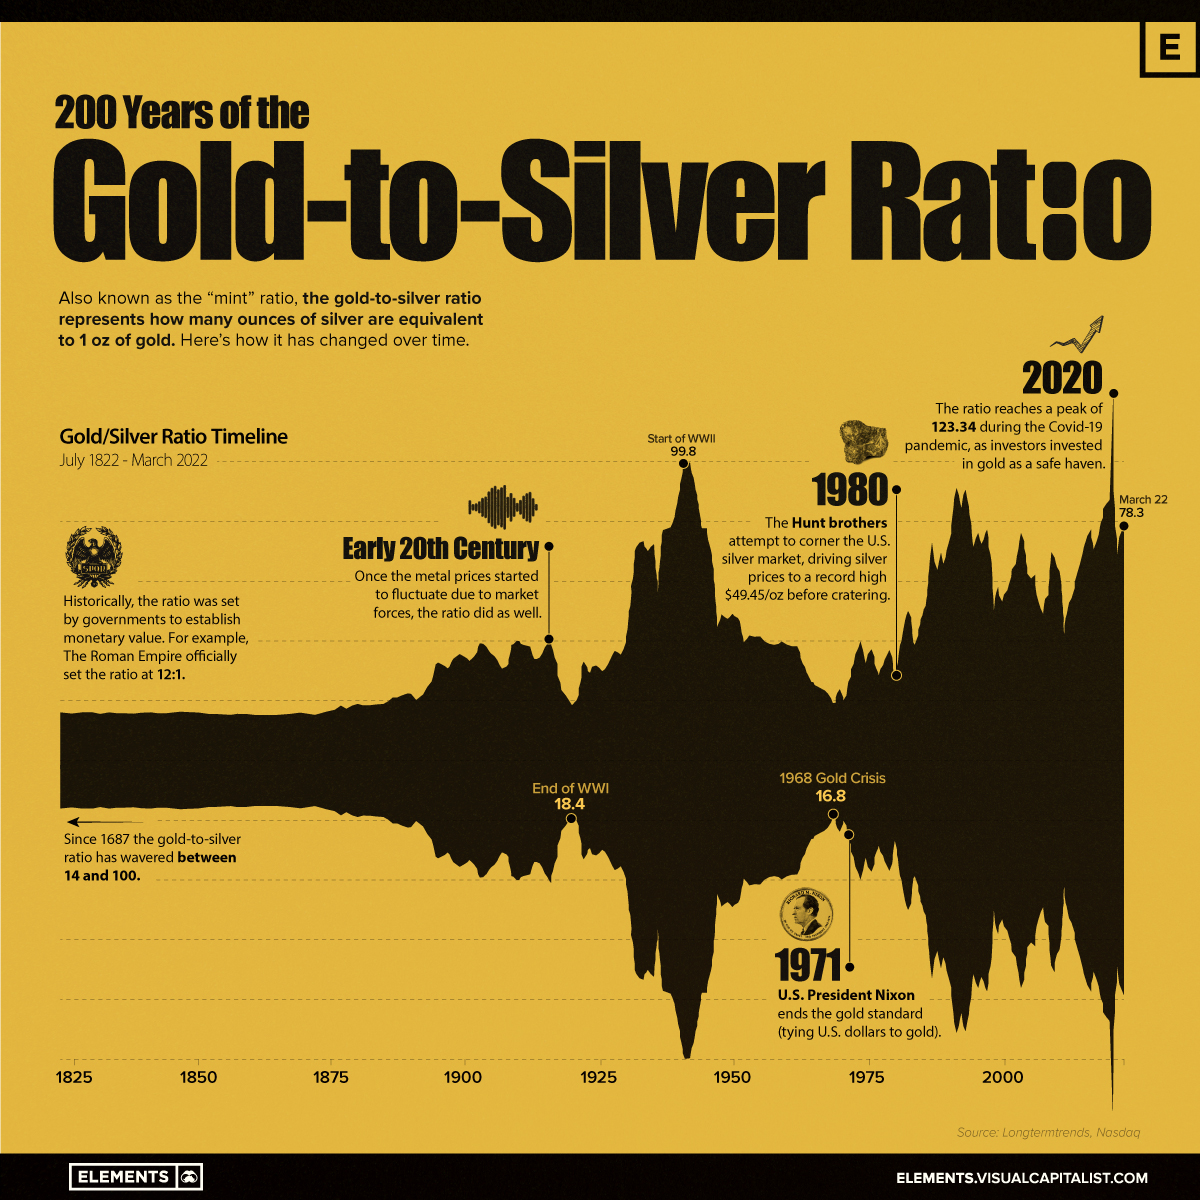
This graphic charts 200 years of the gold-to-silver ratio, plotting the pivotal historical events that have shaped its peaks and valleys.
What is the Gold-to-Silver Ratio?
The gold-to-silver ratio represents the amount of silver ounces equivalent to a single ounce of gold, enabling us to see if one of the two precious metals is particularly under or overvalued.
Currently, the ratio sits at about 80 ounces of silver equivalent to one ounce of gold. This is after the ratio spiked to new highs of 123.3 during the COVID-19 pandemic.
While gold is primarily viewed as an inflation and recession hedge, silver is also an industrial metal and asset. The ratio between the two can reveal whether industrial metals demand is on the rise or if an economic slowdown or recession may be looming.
The History of the Gold-to-Silver Ratio
Long before the gold-to-silver ratio was allowed to float freely, the ratio between these two metals was fixed by empires and governments to control the value of their currency and coinage.
The earliest recorded instance of the gold-to-silver ratio dates back to 3200 BCE, when Menes, the first king of Ancient Egypt set a ratio of 2.5:1. Since then, the ratio has only seen gold’s value rise as empires and governments became more familiar with the scarcity and difficulty of production for the two metals.
Gold and Silver’s Ancient Beginnings
Ancient Rome was one of the earliest ancient civilizations to set a gold-to-silver ratio, starting as low as 8:1 in 210 BCE. Over the decades, varying gold and silver inflows from Rome’s conquests caused the ratio to fluctuate between 8-12 ounces of silver for every ounce of gold.
By 46 BCE, Julius Caesar had established a standard gold-to-silver ratio of 11.5:1, shortly before it was bumped to 11.75:1 under emperor Augustus.
As centuries progressed, ratios around the world fluctuated between 6-12 ounces of silver for every ounce of gold, with many Middle Eastern and Asian empires and nations often valuing silver more highly than Western counterparts, thus having a lower ratio.
The Rise of the Fixed Ratio
By the 18th century, the gold-to-silver ratio was being redefined by the U.S. government’s Coinage Act of 1792 which set the ratio at 15:1. This act was the basis for U.S. coinage, defining coins’ values by their metallic compositions and weights.
Around the same time period, France had enacted a ratio of 15.5:1, however, neither of these fixed ratios lasted long. The growth of the industrial revolution and the volatility of two world wars resulted in massive fluctuations in currencies, gold, and silver. By the 20th century, the ratio had already reached highs of around 40:1, with the start of World War II further pushing the ratio to a high of nearly 100:1.
Recently in 2020, the ratio set new highs of more than 123:1, as pandemic fears saw investors pile into gold as a safe-haven asset. While the gold-to-silver ratio has since fallen to roughly 80:1, runaway inflation and a potential recession has put gold in the spotlight again, likely bringing further volatility to this historic ratio.


Real Assets
Charted: The Value Gap Between the Gold Price and Gold Miners
While gold prices hit all-time highs, gold mining stocks have lagged far behind.

Gold Price vs. Gold Mining Stocks
This was originally posted on our Voronoi app. Download the app for free on Apple or Android and discover incredible data-driven charts from a variety of trusted sources.
Although the price of gold has reached new record highs in 2024, gold miners are still far from their 2011 peaks.
In this graphic, we illustrate the evolution of gold prices since 2000 compared to the NYSE Arca Gold BUGS Index (HUI), which consists of the largest and most widely held public gold production companies. The data was compiled by Incrementum AG.
Mining Stocks Lag Far Behind
In April 2024, gold reached a new record high as Federal Reserve Chair Jerome Powell signaled policymakers may delay interest rate cuts until clearer signs of declining inflation materialize.
Additionally, with elections occurring in more than 60 countries in 2024 and ongoing conflicts in Ukraine and Gaza, central banks are continuing to buy gold to strengthen their reserves, creating momentum for the metal.
Traditionally known as a hedge against inflation and a safe haven during times of political and economic uncertainty, gold has climbed over 11% so far this year.
According to Business Insider, gold miners experienced their best performance in a year in March 2024. During that month, the gold mining sector outperformed all other U.S. industries, surpassing even the performance of semiconductor stocks.
Still, physical gold has outperformed shares of gold-mining companies over the past three years by one of the largest margins in decades.
| Year | Gold Price | NYSE Arca Gold BUGS Index (HUI) |
|---|---|---|
| 2023 | $2,062.92 | $243.31 |
| 2022 | $1,824.32 | $229.75 |
| 2021 | $1,828.60 | $258.87 |
| 2020 | $1,895.10 | $299.64 |
| 2019 | $1,523.00 | $241.94 |
| 2018 | $1,281.65 | $160.58 |
| 2017 | $1,296.50 | $192.31 |
| 2016 | $1,151.70 | $182.31 |
| 2015 | $1,060.20 | $111.18 |
| 2014 | $1,199.25 | $164.03 |
| 2013 | $1,201.50 | $197.70 |
| 2012 | $1,664.00 | $444.22 |
| 2011 | $1,574.50 | $498.73 |
| 2010 | $1,410.25 | $573.32 |
| 2009 | $1,104.00 | $429.91 |
| 2008 | $865.00 | $302.41 |
| 2007 | $836.50 | $409.37 |
| 2006 | $635.70 | $338.24 |
| 2005 | $513.00 | $276.90 |
| 2004 | $438.00 | $215.33 |
| 2003 | $417.25 | $242.93 |
| 2002 | $342.75 | $145.12 |
| 2001 | $276.50 | $65.20 |
| 2000 | $272.65 | $40.97 |
Among the largest companies on the NYSE Arca Gold BUGS Index, Colorado-based Newmont has experienced a 24% drop in its share price over the past year. Similarly, Canadian Barrick Gold also saw a decline of 6.5% over the past 12 months.
Real Assets
200 Years of Global Gold Production, by Country
Global gold production has grown exponentially since the 1800s, with 86% of all above-ground gold mined in the last 200 years.


Visualizing Global Gold Production Over 200 Years
Although the practice of gold mining has been around for thousands of years, it’s estimated that roughly 86% of all above-ground gold was extracted in the last 200 years.
With modern mining techniques making large-scale production possible, global gold production has grown exponentially since the 1800s.
The above infographic uses data from Our World in Data to visualize global gold production by country from 1820 to 2022, showing how gold mining has evolved to become increasingly global over time.
A Brief History of Gold Mining
The best-known gold rush in modern history occurred in California in 1848, when James Marshall discovered gold in Sacramento Valley. As word spread, thousands of migrants flocked to California in search of gold, and by 1855, miners had extracted around $2 billion worth of gold.
The United States, Australia, and Russia were (interchangeably) the three largest gold producers until the 1890s. Then, South Africa took the helm thanks to the massive discovery in the Witwatersrand Basin, now regarded today as one of the world’s greatest ever goldfields.
South Africa’s annual gold production peaked in 1970 at 1,002 tonnes—by far the largest amount of gold produced by any country in a year.
With the price of gold rising since the 1980s, global gold production has become increasingly widespread. By 2007, China was the world’s largest gold-producing nation, and today a significant quantity of gold is being mined in over 40 countries.
The Top Gold-Producing Countries in 2022
Around 31% of the world’s gold production in 2022 came from three countries—China, Russia, and Australia, with each producing over 300 tonnes of the precious metal.
| Rank | Country | 2022E Gold Production, tonnes | % of Total |
|---|---|---|---|
| #1 | 🇨🇳 China | 330 | 11% |
| #2 | 🇷🇺 Russia | 320 | 10% |
| #3 | 🇦🇺 Australia | 320 | 10% |
| #4 | 🇨🇦 Canada | 220 | 7% |
| #5 | 🇺🇸 United States | 170 | 5% |
| #6 | 🇲🇽 Mexico | 120 | 4% |
| #7 | 🇰🇿 Kazakhstan | 120 | 4% |
| #8 | 🇿🇦 South Africa | 110 | 4% |
| #9 | 🇵🇪 Peru | 100 | 3% |
| #10 | 🇺🇿 Uzbekistan | 100 | 3% |
| #11 | 🇬🇭 Ghana | 90 | 3% |
| #12 | 🇮🇩 Indonesia | 70 | 2% |
| - | 🌍 Rest of the World | 1,030 | 33% |
| - | World Total | 3,100 | 100% |
North American countries Canada, the U.S., and Mexico round out the top six gold producers, collectively making up 16% of the global total. The state of Nevada alone accounted for 72% of U.S. production, hosting the world’s largest gold mining complex (including six mines) owned by Nevada Gold Mines.
Meanwhile, South Africa produced 110 tonnes of gold in 2022, down by 74% relative to its output of 430 tonnes in 2000. This long-term decline is the result of mine closures, maturing assets, and industrial conflict, according to the World Gold Council.
Interestingly, two smaller gold producers on the list, Uzbekistan and Indonesia, host the second and third-largest gold mining operations in the world, respectively.
The Outlook for Global Gold Production
As of April 25, gold prices were hovering around the $2,000 per ounce mark and nearing all-time highs. For mining companies, higher gold prices can mean more profits per ounce if costs remain unaffected.
According to the World Gold Council, mined gold production is expected to increase in 2023 and could surpass the record set in 2018 (3,300 tonnes), led by the expansion of existing projects in North America. The chances of record mine output could be higher if gold prices continue to increase.

-

 Electrification3 years ago
Ranked: The Top 10 EV Battery Manufacturers
-

 Electrification2 years ago
The Key Minerals in an EV Battery
-

 Real Assets3 years ago
The World’s Top 10 Gold Mining Companies
-

 Misc3 years ago
All the Metals We Mined in One Visualization
-

 Electrification3 years ago
The Biggest Mining Companies in the World in 2021
-

 Energy Shift2 years ago
What Are the Five Major Types of Renewable Energy?
-

 Electrification2 years ago
The World’s Largest Nickel Mining Companies
-

 Electrification2 years ago
Mapped: Solar Power by Country in 2021