

Energy Shift
Visualizing the World’s Largest Oil Producers


The World’s Largest Oil Producers
The world is in the middle of the first energy crisis of the 21st century.
High energy prices, especially for oil, gas, and coal, are driving decades-high inflation in various countries, some of which are also experiencing energy shortages. Russia’s recent invasion of Ukraine has exacerbated the crisis, given that the country is both a major producer and exporter of oil and natural gas.
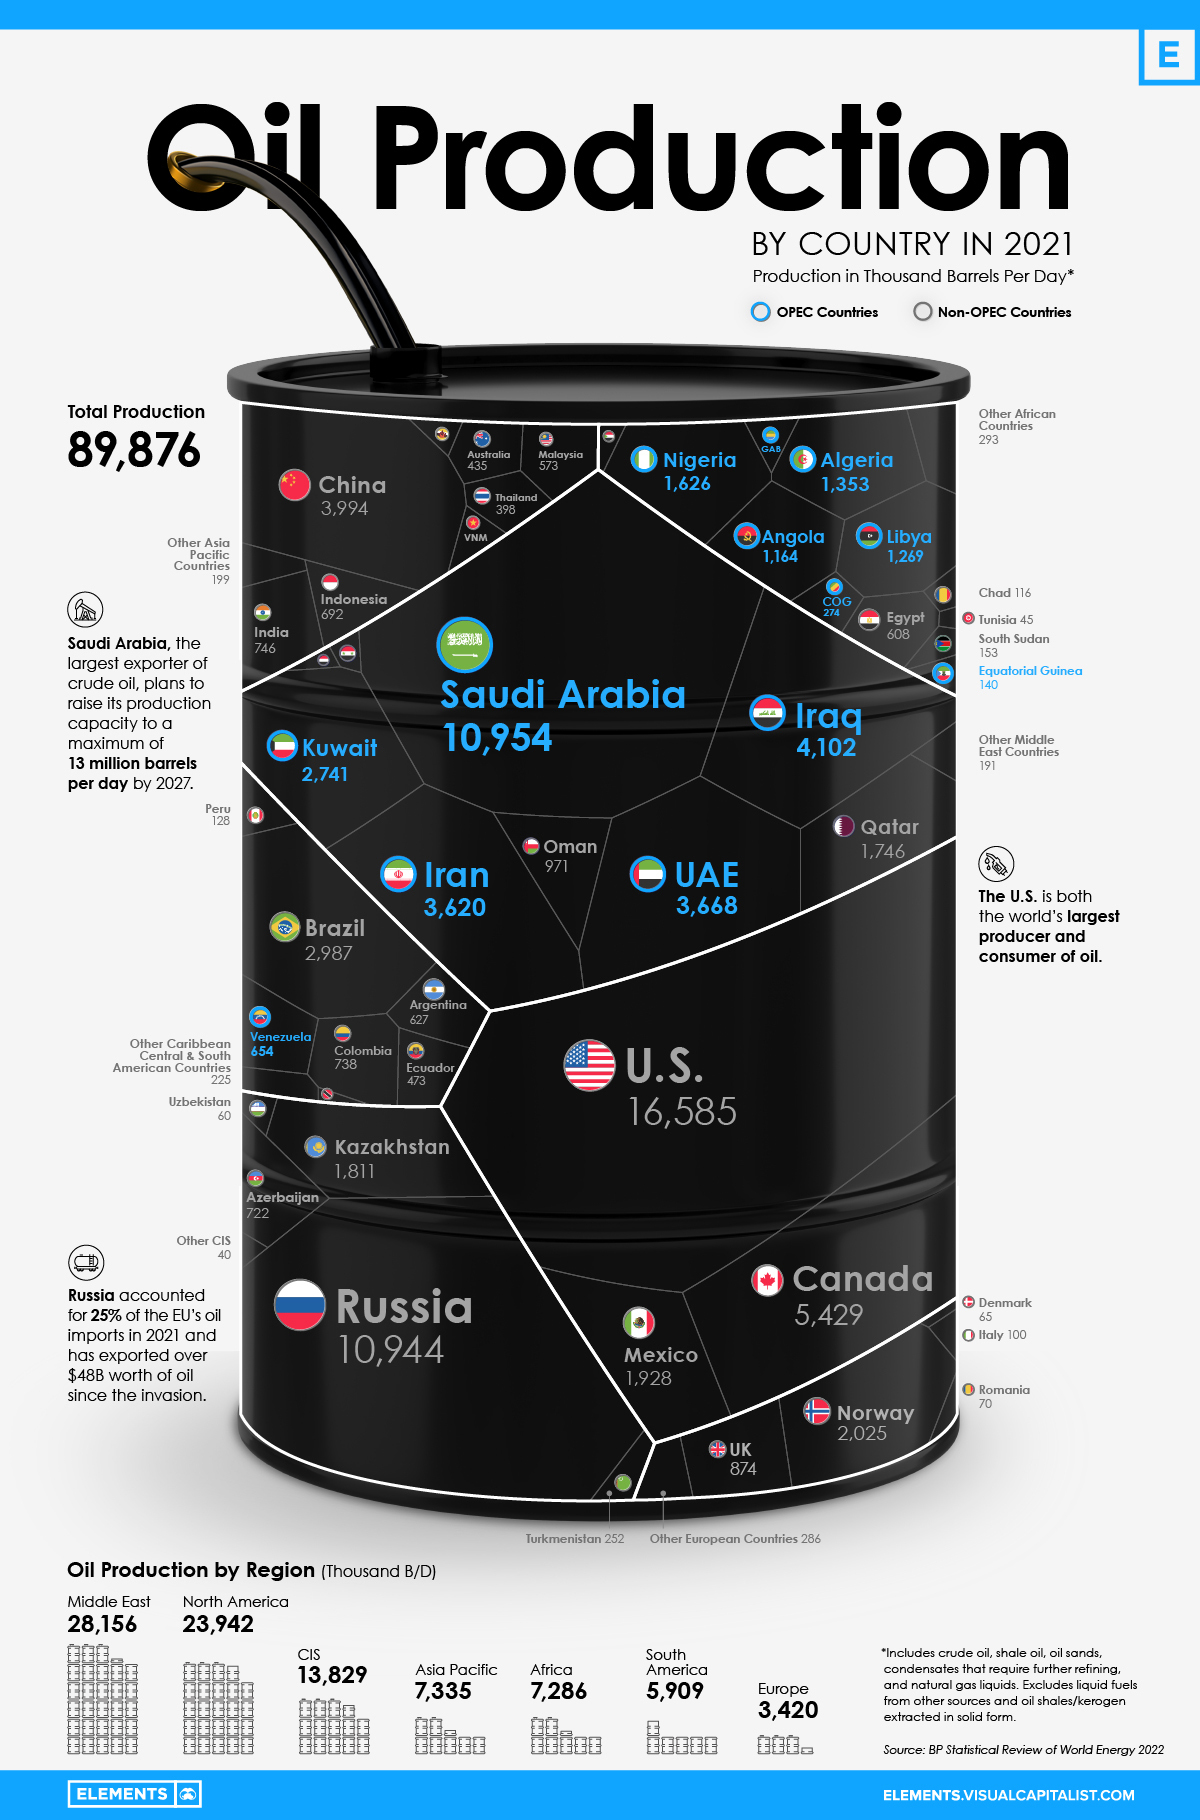
Using data from BP’s Statistical Review of World Energy, the above infographic provides further context on the crisis by visualizing the world’s largest oil producers in 2021.
Oil Production: OPEC Countries vs. Rest of the World
Before looking at country-level data, it’s worth seeing the amount of oil the Organization of Petroleum Exporting Countries (OPEC) produces compared to other organizations and regions.
| Region/Organization | 2021 Oil Production (barrels per day) | % of Total |
|---|---|---|
| OPEC | 31.7M | 35% |
| North America | 23.9M | 27% |
| Commonwealth of Independent States (CIS) | 13.8M | 15% |
| Rest of the World | 20.5M | 23% |
| Total | 89.9M | 100% |
The OPEC countries are the largest oil producers collectively, with Saudi Arabia alone making up one-third of OPEC production. It’s also important to note that OPEC production remains below pre-pandemic levels after the organization reduced its output by an unprecedented 10 million barrels per day (B/D) in 2020.
Following the OPEC countries, the U.S., Canada, and Mexico accounted for just over a quarter of global oil production in 2021. Nearly 70% of North American oil production came from the U.S., the world’s largest oil producer.
Similarly, within the CIS—an organization of post-Soviet Union countries—Russia was by far the largest producer, accounting for 80% of total CIS production.
The Largest Oil Producers in 2021
Roughly 43% of the world’s oil production came from just three countries in 2021—the U.S., Saudi Arabia, and Russia. Together, these three countries produced more oil than the rest of the top 10 combined.
| Country | 2021 Oil Production (barrels per day) | % of Total |
|---|---|---|
| U.S. 🇺🇸 | 16.6M | 18.5% |
| Saudi Arabia 🇸🇦 | 11M | 12.2% |
| Russian Federation 🇷🇺 | 10.9M | 12.2% |
| Canada 🇨🇦 | 5.4M | 6.0% |
| Iraq 🇮🇶 | 4.1M | 4.6% |
| China 🇨🇳 | 4.0M | 4.4% |
| United Arab Emirates 🇦🇪 | 3.7M | 4.1% |
| Iran 🇮🇷 | 3.6M | 4.0% |
| Brazil 🇧🇷 | 3.0M | 3.3% |
| Kuwait 🇰🇼 | 2.7M | 3.0% |
| Norway 🇳🇴 | 2.0M | 2.3% |
| Mexico 🇲🇽 | 1.9M | 2.1% |
| Kazakhstan 🇰🇿 | 1.8M | 2.0% |
| Qatar 🇶🇦 | 1.7M | 1.9% |
| Nigeria 🇳🇬 | 1.6M | 1.8% |
| Algeria 🇩🇿 | 1.4M | 1.5% |
| Libya 🇱🇾 | 1.3M | 1.4% |
| Angola 🇦🇴 | 1.2M | 1.3% |
| Oman 🇴🇲 | 0.97M | 1.1% |
| United Kingdom 🇬🇧 | 0.87M | 1.0% |
| India 🇮🇳 | 0.75M | 0.8% |
| Colombia 🇨🇴 | 0.74M | 0.8% |
| Azerbaijan 🇦🇿 | 0.72M | 0.8% |
| Indonesia 🇮🇩 | 0.69M | 0.8% |
| Venezuela 🇻🇪 | 0.65M | 0.7% |
| Argentina 🇦🇷 | 0.63M | 0.7% |
| Egypt 🇪🇬 | 0.60M | 0.7% |
| Malaysia 🇲🇾 | 0.57M | 0.6% |
| Ecuador 🇪🇨 | 0.47M | 0.5% |
| Australia 🇦🇺 | 0.44M | 0.5% |
| Thailand 🇹🇭 | 0.39M | 0.4% |
| Republic of Congo 🇨🇬 | 0.27M | 0.3% |
| Turkmenistan 🇹🇲 | 0.25M | 0.3% |
| Vietnam 🇻🇳 | 0.19M | 0.2% |
| Gabon 🇬🇦 | 0.18M | 0.2% |
| South Sudan 🇸🇩 | 0.15M | 0.2% |
| Equatorial Guinea 🇬🇳 | 0.14M | 0.2% |
| Peru 🇵🇪 | 0.13M | 0.1% |
| Chad 🇹🇩 | 0.12M | 0.1% |
| Brunei 🇧🇳 | 0.10M | 0.1% |
| Italy 🇮🇹 | 0.10M | 0.1% |
| Syria 🇸🇾 | 0.10M | 0.1% |
| Trinidad & Tobago 🇹🇹 | 0.08M | 0.1% |
| Romania 🇷🇴 | 0.07M | 0.1% |
| Yemen 🇾🇪 | 0.07M | 0.1% |
| Denmark 🇩🇰 | 0.07M | 0.1% |
| Sudan 🇸🇩 | 0.06M | 0.1% |
| Uzbekistan 🇺🇿 | 0.06M | 0.1% |
| Tunisia 🇹🇳 | 0.05M | 0.1% |
| Rest of the World 🌍 | 1.2M | 1.4% |
| Total | 89.9M | 100.0% |
Over the last few decades, U.S. oil production has been on a rollercoaster of troughs and peaks. After falling from its 1970 peak of 11.3 million B/D, it reached a historic low of 6.8 million B/D in 2008. However, following a turnaround in the 2010s, the country has since surpassed Saudi Arabia as the largest oil producer. As of 2021, though, the U.S. remained a net importer of crude oil while exporting refined petroleum products.
Saudi Arabia and Russia each produced roughly 11 million B/D in 2021 and were the two largest oil exporters globally. In both countries, state-owned oil firms (Saudi Aramco and Gazprom, respectively) were the most valuable oil and gas producing companies.
From Europe (excluding Russia), only Norway made the top 15 oil producers, accounting for 2.3% of global production. The lack of regional output partly explains the European Union’s dependence on Russian oil and gas, worsening the region’s energy crisis.
How the Energy Crisis is Affecting Oil Production
After a deep dive in 2020, oil demand is resurfacing and is now above pre-pandemic levels. Furthermore, supply constraints due to sanctions on Russian oil and gas tighten the market and support high oil prices.
While the impact has been felt globally, European countries have been hit hard due to their reliance on Russia’s fossil fuel exports, with some getting almost all of their energy fuels from Russia.
To combat the oil crunch, the rest of the world is ramping up oil supply through increased production or releasing strategic petroleum reserves (SPRs). U.S. oil production is expected to rise by 1 million B/D in 2022 to a record-high. Simultaneously, Western nations are calling on OPEC members to increase their output to ease prices. However, OPEC nations are sticking to their planned production hikes, with output still below early 2020 levels.
“We had a good discussion on ensuring global energy security and adequate oil supplies to support global economic growth. And that will begin shortly.”– U.S. President Joe Biden on his recent visit to Saudi Arabia
The U.S. is releasing 180 million barrels of oil from its SPR, of which 60 million barrels will contribute to the IEA’s collective release of 120 million barrels. But with oil demand expected to reach a new all-time high in 2023, it remains to be seen whether these efforts to increase supply will be enough to curb the crunch.


Energy Shift
The World’s Biggest Oil Producers in 2023
Just three countries accounted for 40% of global oil production last year.

The World’s Biggest Oil Producers in 2023
This was originally posted on our Voronoi app. Download the app for free on iOS or Android and discover incredible data-driven charts from a variety of trusted sources.
Despite efforts to decarbonize the global economy, oil still remains one of the world’s most important resources. It’s also produced by a fairly limited group of countries, which can be a source of economic and political leverage.
This graphic illustrates global crude oil production in 2023, measured in million barrels per day, sourced from the U.S. Energy Information Administration (EIA).
Three Countries Account for 40% of Global Oil Production
In 2023, the United States, Russia, and Saudi Arabia collectively contributed 32.7 million barrels per day to global oil production.
| Oil Production 2023 | Million barrels per day |
|---|---|
| 🇺🇸 U.S. | 12.9 |
| 🇷🇺 Russia | 10.1 |
| 🇸🇦 Saudi Arabia | 9.7 |
| 🇨🇦 Canada | 4.6 |
| 🇮🇶 Iraq | 4.3 |
| 🇨🇳 China | 4.2 |
| 🇮🇷 Iran | 3.6 |
| 🇧🇷 Brazil | 3.4 |
| 🇦🇪 UAE | 3.4 |
| 🇰🇼 Kuwait | 2.7 |
| 🌍 Other | 22.8 |
These three nations have consistently dominated oil production since 1971. The leading position, however, has alternated among them over the past five decades.
In contrast, the combined production of the next three largest producers—Canada, Iraq, and China—reached 13.1 million barrels per day in 2023, just surpassing the production of the United States alone.
In the near term, no country is likely to surpass the record production achieved by the U.S. in 2023, as no other producer has ever reached a daily capacity of 13.0 million barrels. Recently, Saudi Arabia’s state-owned Saudi Aramco scrapped plans to increase production capacity to 13.0 million barrels per day by 2027.
In 2024, analysts forecast that the U.S. will maintain its position as the top oil producer. In fact, according to Macquarie Group, U.S. oil production is expected to achieve a record pace of about 14 million barrels per day by the end of the year.
Energy Shift
How Much Does the U.S. Depend on Russian Uranium?
Despite a new uranium ban being discussed in Congress, the U.S. is still heavily dependent on Russian uranium.

How Much Does the U.S. Depend on Russian Uranium?
This was originally posted on our Voronoi app. Download the app for free on iOS or Android and discover incredible data-driven charts from a variety of trusted sources.
The U.S. House of Representatives recently passed a ban on imports of Russian uranium. The bill must pass the Senate before becoming law.
In this graphic, we visualize how much the U.S. relies on Russian uranium, based on data from the United States Energy Information Administration (EIA).
U.S. Suppliers of Enriched Uranium
After Russia invaded Ukraine, the U.S. imposed sanctions on Russian-produced oil and gas—yet Russian-enriched uranium is still being imported.
Currently, Russia is the largest foreign supplier of nuclear power fuel to the United States. In 2022, Russia supplied almost a quarter of the enriched uranium used to fuel America’s fleet of more than 90 commercial reactors.
| Country of enrichment service | SWU* | % |
|---|---|---|
| 🇺🇸 United States | 3,876 | 27.34% |
| 🇷🇺 Russia | 3,409 | 24.04% |
| 🇩🇪 Germany | 1,763 | 12.40% |
| 🇬🇧 United Kingdom | 1,593 | 11.23% |
| 🇳🇱 Netherlands | 1,303 | 9.20% |
| Other | 2,232 | 15.79% |
| Total | 14,176 | 100% |
SWU stands for “Separative Work Unit” in the uranium industry. It is a measure of the amount of work required to separate isotopes of uranium during the enrichment process. Source: U.S. Energy Information Administration
Most of the remaining uranium is imported from European countries, while another portion is produced by a British-Dutch-German consortium operating in the United States called Urenco.
Similarly, nearly a dozen countries around the world depend on Russia for more than half of their enriched uranium—and many of them are NATO-allied members and allies of Ukraine.
In 2023 alone, the U.S. nuclear industry paid over $800 million to Russia’s state-owned nuclear energy corporation, Rosatom, and its fuel subsidiaries.
It is important to note that 19% of electricity in the U.S. is powered by nuclear plants.
The dependency on Russian fuels dates back to the 1990s when the United States turned away from its own enrichment capabilities in favor of using down-blended stocks of Soviet-era weapons-grade uranium.
As part of the new uranium-ban bill, the Biden administration plans to allocate $2.2 billion for the expansion of uranium enrichment facilities in the United States.

-

 Electrification3 years ago
Ranked: The Top 10 EV Battery Manufacturers
-

 Electrification2 years ago
The Key Minerals in an EV Battery
-

 Real Assets3 years ago
The World’s Top 10 Gold Mining Companies
-

 Misc3 years ago
All the Metals We Mined in One Visualization
-

 Electrification3 years ago
The Biggest Mining Companies in the World in 2021
-

 Energy Shift2 years ago
What Are the Five Major Types of Renewable Energy?
-

 Electrification2 years ago
Mapped: Solar Power by Country in 2021
-

 Electrification2 years ago
The World’s Largest Nickel Mining Companies