

Real Assets
Visualizing U.S. Crude Oil and Petroleum Product Imports in 2021
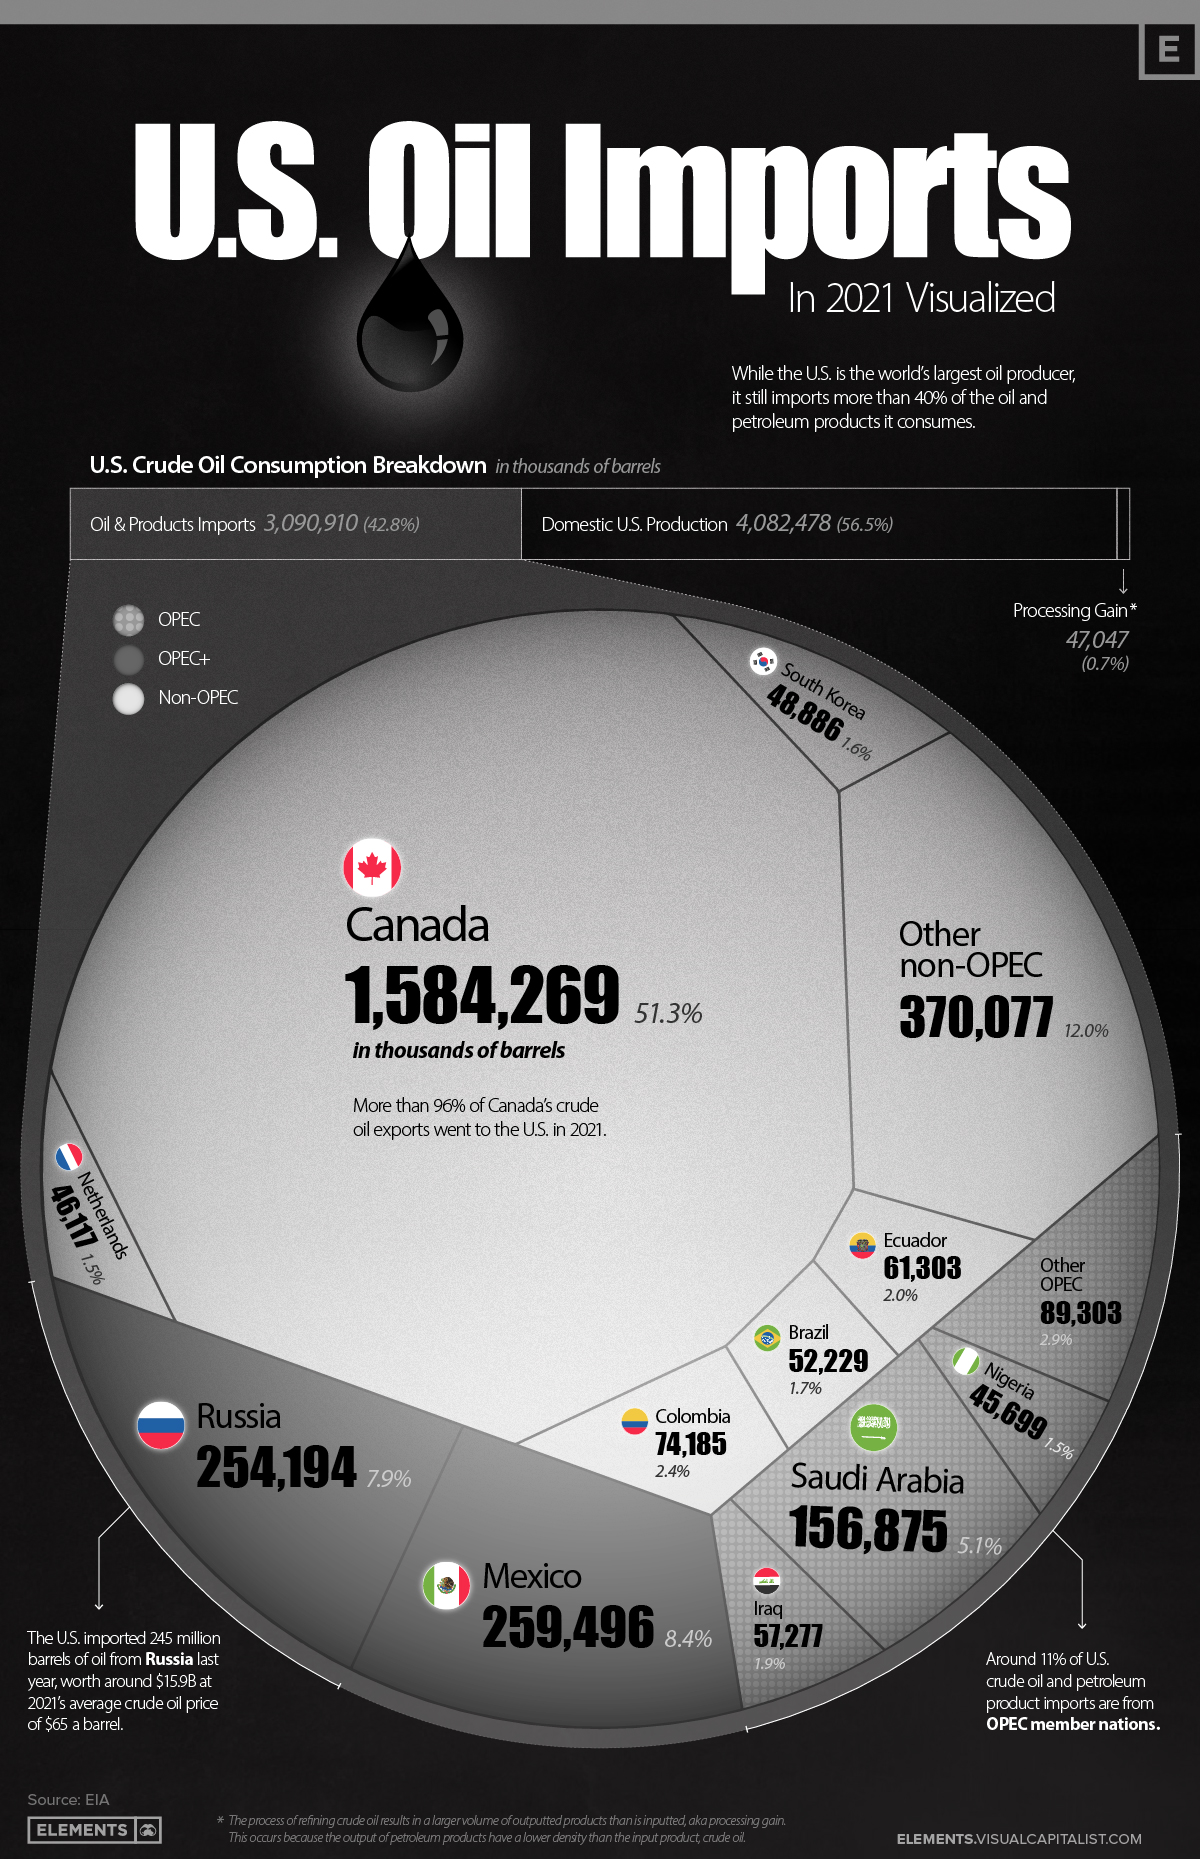
U.S. Petroleum Product and Crude Oil Imports in 2021: Visualized
Energy independence is top of mind for many nations as Russia’s invasion of Ukraine has prompted sanctions and bans against Russian coal and crude oil imports.
Despite being the world’s largest oil producer, in 2021 the U.S. still imported more than 3 billion barrels of crude oil and petroleum products, equal to 43% of the country’s consumption.
This visualization uses data from the Energy Information Administration (EIA) to compare U.S. crude oil and refined product imports with domestic crude oil production, and breaks down which countries the U.S. imported its oil from in 2021.
U.S. Crude Oil Imports, by Country
The U.S. imports more than 8 million barrels of petroleum products a day from other nations, making it the world’s second-largest importer of crude oil behind China.
America’s northern neighbor, Canada, is the largest source of petroleum imports at 1.58 billion barrels in 2021. These made up more than 51% of U.S. petroleum imports, and when counting only crude oil imports, Canada’s share rises to 62%.
| Rank | Country | U.S. Oil Imports (2021, in barrels) | Share |
|---|---|---|---|
| #1 | 🇨🇦 Canada | 1,584 million | 51.3% |
| #2 | 🇲🇽 Mexico | 259 million | 8.4% |
| #3 | 🇷🇺 Russia | 254 million | 7.9% |
| #4 | 🇸🇦 Saudi Arabia | 156 million | 5.1% |
| #5 | 🇨🇴 Colombia | 74 million | 2.4% |
| #6 | 🇪🇨 Ecuador | 61 million | 2.0% |
| #7 | 🇮🇶 Iraq | 57 million | 1.9% |
| #8 | 🇧🇷 Brazil | 52 million | 1.7% |
| #9 | 🇰🇷 South Korea | 48 million | 1.6% |
| #10 | 🇳🇱 Netherlands | 46 million | 1.5% |
| #11 | 🇳🇬 Nigeria | 45 million | 1.5% |
| Other countries | 459 million | 14.7% | |
| Total | 3,091 million | 100.0% |
The second-largest contributor to U.S. petroleum imports was another neighbor, Mexico, with 259 million barrels imported in 2021—making up a bit more than 8% of U.S. petroleum imports.
Russia was the third-largest exporter of crude oil and petroleum products to the U.S. in 2021, with their 254 million barrels accounting for almost 8% of total imports.
U.S. Crude Oil and Petroleum Imports from OPEC and OPEC+
Only about 11% of U.S. crude oil and petroleum product imports come from OPEC nations, with another 16.3% coming from OPEC+ members.
While imports from OPEC and OPEC+ members make up more than a quarter of America’s total petroleum imports, this share is fairly small when considering OPEC members currently control nearly 80% of the world’s oil reserves.
Which Countries are Part of OPEC and OPEC-Plus?
The Organization of Petroleum Exporting Countries (OPEC) is a group of 13 petroleum producing nations that formed in 1960 to provide steady prices and supply distribution of crude oil and petroleum products.
In 2016, OPEC-plus was formed with additional oil-exporting nations in order to better control global oil supply and markets in response to a deluge of U.S. shale supply hitting the markets at that time.
OPEC members:
- 🇮🇷 Iran*
- 🇮🇶 Iraq*
- 🇰🇼 Kuwait*
- 🇸🇦 Saudi Arabia*
- 🇻🇪 Venezuela*
- 🇩🇿 Algeria
- 🇦🇴 Angola
- 🇬🇶 Equatorial Guinea
- 🇬🇦 Gabon
- 🇱🇾 Libya
- 🇳🇬 Nigeria
- 🇨🇩 Republic of the Congo
- 🇦🇪 United Arab Emirates
* Founding members
OPEC+ members:
- 🇷🇺 Russia
- 🇲🇽 Mexico
- 🇰🇿 Kazakhstan
- 🇲🇾 Malaysia
- 🇦🇿 Azerbaijan
- 🇧🇭 Bahrain
- 🇧🇳 Brunei
- 🇴🇲 Oman
- 🇸🇩 Sudan
- 🇸🇸 South Sudan
Although OPEC and OPEC+ members supply a significant part of U.S. crude oil and petroleum imports, America has avoided overdependence on the group by instead building strong ties with neighboring exporters Canada and Mexico.
Crude Oil Imports Capitalize on U.S. Refineries
While the U.S. has been a net exporter of crude oil and petroleum products the past two years, exporting 3.15 billion barrels while importing 3.09 billion barrels in 2021, crude oil-only trade tells a different story.
In terms of just crude oil trade, the U.S. was a significant net importer, with 2.23 billion barrels of crude oil imports and only 1.08 billion barrels of crude oil exports. But with the U.S. being the world’s largest crude oil producer, why is this?
As noted earlier, neighboring Canada makes up larger shares of U.S. crude oil imports compared to crude oil and petroleum product imports. Similarly, Mexico reaches 10% of America’s crude oil imports when excluding petroleum products.
Maximizing imports from neighboring countries makes sense on multiple fronts for all parties due to lower transportation costs and risks, and it’s no surprise Canada and Mexico are providing large shares of just crude oil as well. With such a large collection of oil refineries across the border, it’s ultimately more cost-efficient for Canada and Mexico to tap into U.S. oil refining rather than refining domestically.
In turn, Mexico is the largest importer of U.S. produced gasoline and diesel fuel, and Canada is the third-largest importer of American-produced refined petroleum products.
Replacing Russian Crude Oil Imports
While Russia only makes up 8% of American petroleum product imports, their 254 million barrels will need to be replaced as both countries ceased trading soon after Russia’s invasion of Ukraine.
In an effort to curb rising oil and gasoline prices, in March President Joe Biden announced the release of up to 180 million barrels from the U.S. Strategic Petroleum Reserves. Other IEA nations are also releasing emergency oil reserves in an attempt to curb rising prices at the pump and volatility in the oil market.
While the U.S. and the rest of the world are still managing the short-term solutions to this oil supply gap, the long-term solution is complex and has various moving parts. From ramping up domestic oil production to replacing oil demand with other cleaner energy solutions, oil trade and imports will remain a vital part of America’s energy supply.


Real Assets
Charted: The Value Gap Between the Gold Price and Gold Miners
While gold prices hit all-time highs, gold mining stocks have lagged far behind.

Gold Price vs. Gold Mining Stocks
This was originally posted on our Voronoi app. Download the app for free on Apple or Android and discover incredible data-driven charts from a variety of trusted sources.
Although the price of gold has reached new record highs in 2024, gold miners are still far from their 2011 peaks.
In this graphic, we illustrate the evolution of gold prices since 2000 compared to the NYSE Arca Gold BUGS Index (HUI), which consists of the largest and most widely held public gold production companies. The data was compiled by Incrementum AG.
Mining Stocks Lag Far Behind
In April 2024, gold reached a new record high as Federal Reserve Chair Jerome Powell signaled policymakers may delay interest rate cuts until clearer signs of declining inflation materialize.
Additionally, with elections occurring in more than 60 countries in 2024 and ongoing conflicts in Ukraine and Gaza, central banks are continuing to buy gold to strengthen their reserves, creating momentum for the metal.
Traditionally known as a hedge against inflation and a safe haven during times of political and economic uncertainty, gold has climbed over 11% so far this year.
According to Business Insider, gold miners experienced their best performance in a year in March 2024. During that month, the gold mining sector outperformed all other U.S. industries, surpassing even the performance of semiconductor stocks.
Still, physical gold has outperformed shares of gold-mining companies over the past three years by one of the largest margins in decades.
| Year | Gold Price | NYSE Arca Gold BUGS Index (HUI) |
|---|---|---|
| 2023 | $2,062.92 | $243.31 |
| 2022 | $1,824.32 | $229.75 |
| 2021 | $1,828.60 | $258.87 |
| 2020 | $1,895.10 | $299.64 |
| 2019 | $1,523.00 | $241.94 |
| 2018 | $1,281.65 | $160.58 |
| 2017 | $1,296.50 | $192.31 |
| 2016 | $1,151.70 | $182.31 |
| 2015 | $1,060.20 | $111.18 |
| 2014 | $1,199.25 | $164.03 |
| 2013 | $1,201.50 | $197.70 |
| 2012 | $1,664.00 | $444.22 |
| 2011 | $1,574.50 | $498.73 |
| 2010 | $1,410.25 | $573.32 |
| 2009 | $1,104.00 | $429.91 |
| 2008 | $865.00 | $302.41 |
| 2007 | $836.50 | $409.37 |
| 2006 | $635.70 | $338.24 |
| 2005 | $513.00 | $276.90 |
| 2004 | $438.00 | $215.33 |
| 2003 | $417.25 | $242.93 |
| 2002 | $342.75 | $145.12 |
| 2001 | $276.50 | $65.20 |
| 2000 | $272.65 | $40.97 |
Among the largest companies on the NYSE Arca Gold BUGS Index, Colorado-based Newmont has experienced a 24% drop in its share price over the past year. Similarly, Canadian Barrick Gold also saw a decline of 6.5% over the past 12 months.
Real Assets
200 Years of Global Gold Production, by Country
Global gold production has grown exponentially since the 1800s, with 86% of all above-ground gold mined in the last 200 years.


Visualizing Global Gold Production Over 200 Years
Although the practice of gold mining has been around for thousands of years, it’s estimated that roughly 86% of all above-ground gold was extracted in the last 200 years.
With modern mining techniques making large-scale production possible, global gold production has grown exponentially since the 1800s.
The above infographic uses data from Our World in Data to visualize global gold production by country from 1820 to 2022, showing how gold mining has evolved to become increasingly global over time.
A Brief History of Gold Mining
The best-known gold rush in modern history occurred in California in 1848, when James Marshall discovered gold in Sacramento Valley. As word spread, thousands of migrants flocked to California in search of gold, and by 1855, miners had extracted around $2 billion worth of gold.
The United States, Australia, and Russia were (interchangeably) the three largest gold producers until the 1890s. Then, South Africa took the helm thanks to the massive discovery in the Witwatersrand Basin, now regarded today as one of the world’s greatest ever goldfields.
South Africa’s annual gold production peaked in 1970 at 1,002 tonnes—by far the largest amount of gold produced by any country in a year.
With the price of gold rising since the 1980s, global gold production has become increasingly widespread. By 2007, China was the world’s largest gold-producing nation, and today a significant quantity of gold is being mined in over 40 countries.
The Top Gold-Producing Countries in 2022
Around 31% of the world’s gold production in 2022 came from three countries—China, Russia, and Australia, with each producing over 300 tonnes of the precious metal.
| Rank | Country | 2022E Gold Production, tonnes | % of Total |
|---|---|---|---|
| #1 | 🇨🇳 China | 330 | 11% |
| #2 | 🇷🇺 Russia | 320 | 10% |
| #3 | 🇦🇺 Australia | 320 | 10% |
| #4 | 🇨🇦 Canada | 220 | 7% |
| #5 | 🇺🇸 United States | 170 | 5% |
| #6 | 🇲🇽 Mexico | 120 | 4% |
| #7 | 🇰🇿 Kazakhstan | 120 | 4% |
| #8 | 🇿🇦 South Africa | 110 | 4% |
| #9 | 🇵🇪 Peru | 100 | 3% |
| #10 | 🇺🇿 Uzbekistan | 100 | 3% |
| #11 | 🇬🇭 Ghana | 90 | 3% |
| #12 | 🇮🇩 Indonesia | 70 | 2% |
| - | 🌍 Rest of the World | 1,030 | 33% |
| - | World Total | 3,100 | 100% |
North American countries Canada, the U.S., and Mexico round out the top six gold producers, collectively making up 16% of the global total. The state of Nevada alone accounted for 72% of U.S. production, hosting the world’s largest gold mining complex (including six mines) owned by Nevada Gold Mines.
Meanwhile, South Africa produced 110 tonnes of gold in 2022, down by 74% relative to its output of 430 tonnes in 2000. This long-term decline is the result of mine closures, maturing assets, and industrial conflict, according to the World Gold Council.
Interestingly, two smaller gold producers on the list, Uzbekistan and Indonesia, host the second and third-largest gold mining operations in the world, respectively.
The Outlook for Global Gold Production
As of April 25, gold prices were hovering around the $2,000 per ounce mark and nearing all-time highs. For mining companies, higher gold prices can mean more profits per ounce if costs remain unaffected.
According to the World Gold Council, mined gold production is expected to increase in 2023 and could surpass the record set in 2018 (3,300 tonnes), led by the expansion of existing projects in North America. The chances of record mine output could be higher if gold prices continue to increase.

-

 Electrification3 years ago
Ranked: The Top 10 EV Battery Manufacturers
-

 Electrification2 years ago
The Key Minerals in an EV Battery
-

 Real Assets3 years ago
The World’s Top 10 Gold Mining Companies
-

 Misc3 years ago
All the Metals We Mined in One Visualization
-

 Electrification3 years ago
The Biggest Mining Companies in the World in 2021
-

 Energy Shift2 years ago
What Are the Five Major Types of Renewable Energy?
-

 Electrification2 years ago
Mapped: Solar Power by Country in 2021
-

 Electrification2 years ago
The World’s Largest Nickel Mining Companies