

Energy Shift
Mapped: Solar and Wind Power by Country


Mapped: Solar and Wind Power by Country
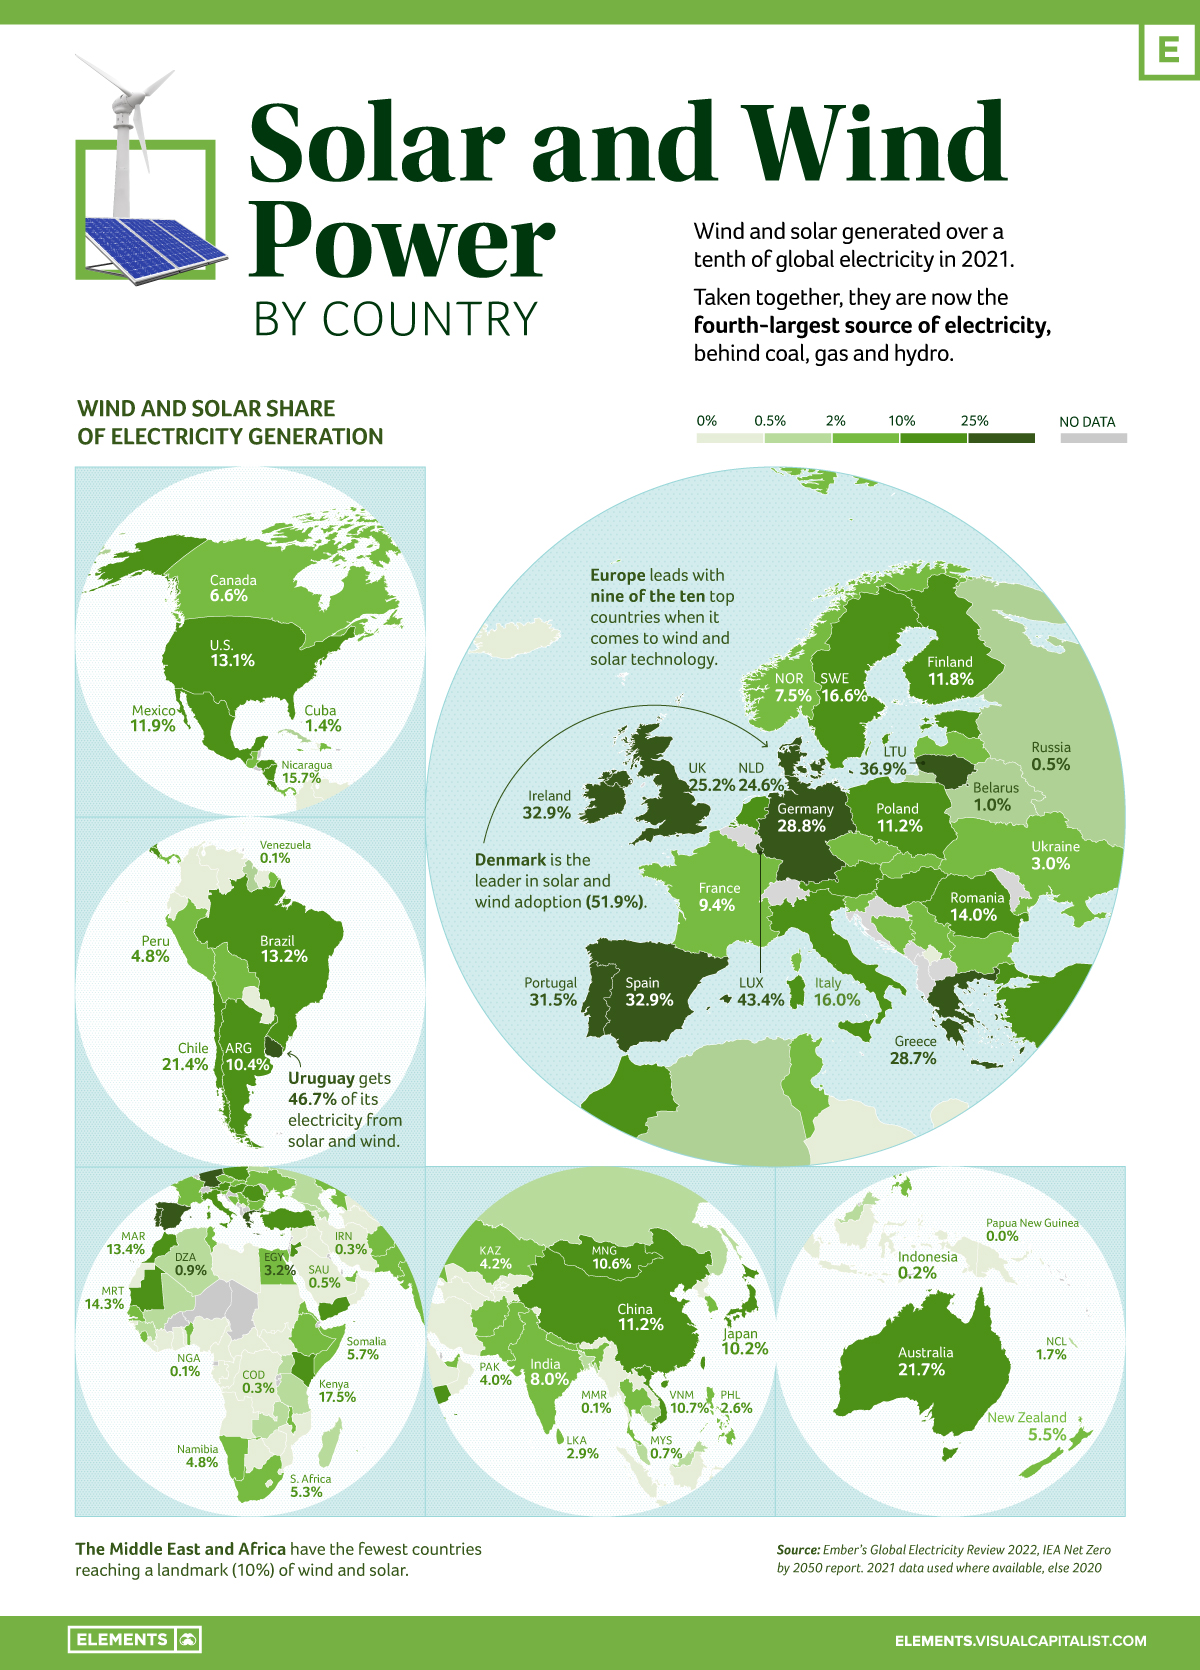
Wind and solar generate over a tenth of the world’s electricity. Taken together, they are the fourth-largest source of electricity, behind coal, gas, and hydro.
This infographic based on data from Ember shows the rise of electricity from these two clean sources over the last decade.
Europe Leads in Wind and Solar
Wind and solar generated 10.3% of global electricity for the first time in 2021, rising from 9.3% in 2020, and doubling their share compared to 2015 when the Paris Climate Agreement was signed.
In fact, 50 countries (26%) generated over a tenth of their electricity from wind and solar in 2021, with seven countries hitting this landmark for the first time: China, Japan, Mongolia, Vietnam, Argentina, Hungary, and El Salvador.
Denmark and Uruguay achieved 52% and 47% respectively, leading the way in technology for high renewable grid integration.
| Rank | Top Countries | Solar/Wind Power Share |
|---|---|---|
| #1 | 🇩🇰 Denmark | 51.9% |
| #2 | 🇺🇾 Uruguay | 46.7% |
| #3 | 🇱🇺 Luxembourg | 43.4% |
| #4 | 🇱🇹 Lithuania | 36.9% |
| #5 | 🇪🇸 Spain | 32.9% |
| #6 | 🇮🇪 Ireland | 32.9% |
| #7 | 🇵🇹 Portugal | 31.5% |
| #8 | 🇩🇪 Germany | 28.8% |
| #9 | 🇬🇷 Greece | 28.7% |
| #10 | 🇬🇧 United Kingdom | 25.2% |
From a regional perspective, Europe leads with nine of the top 10 countries. On the flipside, the Middle East and Africa have the fewest countries reaching the 10% threshold.
Further Renewables Growth Needed to meet Global Climate Goals
The electricity sector was the highest greenhouse gas emitting sector in 2020.
According to the International Energy Agency (IEA), the sector needs to hit net zero globally by 2040 to achieve the Paris Agreement’s goals of limiting global heating to 1.5 degrees. And to hit that goal, wind and solar power need to grow at nearly a 20% clip each year to 2030.
Despite the record rise in renewables, solar and wind electricity generation growth currently doesn’t meet the required marks to reach the Paris Agreement’s goals.
In fact, when the world faced an unprecedented surge in electricity demand in 2021, only 29% of the global rise in electricity demand was met with solar and wind.
Transition Underway
Even as emissions from the electricity sector are at an all-time high, there are signs that the global electricity transition is underway.
Governments like the U.S., Germany, UK, and Canada are planning to increase their share of clean electricity within the next decade and a half. Investments are also coming from the private sector, with companies like Amazon and Apple extending their positions on renewable energy to become some of the biggest buyers overall.
More wind and solar are being added to grids than ever, with renewables expected to provide the majority of clean electricity needed to phase out fossil fuels.


Energy Shift
The World’s Biggest Oil Producers in 2023
Just three countries accounted for 40% of global oil production last year.

The World’s Biggest Oil Producers in 2023
This was originally posted on our Voronoi app. Download the app for free on iOS or Android and discover incredible data-driven charts from a variety of trusted sources.
Despite efforts to decarbonize the global economy, oil still remains one of the world’s most important resources. It’s also produced by a fairly limited group of countries, which can be a source of economic and political leverage.
This graphic illustrates global crude oil production in 2023, measured in million barrels per day, sourced from the U.S. Energy Information Administration (EIA).
Three Countries Account for 40% of Global Oil Production
In 2023, the United States, Russia, and Saudi Arabia collectively contributed 32.7 million barrels per day to global oil production.
| Oil Production 2023 | Million barrels per day |
|---|---|
| 🇺🇸 U.S. | 12.9 |
| 🇷🇺 Russia | 10.1 |
| 🇸🇦 Saudi Arabia | 9.7 |
| 🇨🇦 Canada | 4.6 |
| 🇮🇶 Iraq | 4.3 |
| 🇨🇳 China | 4.2 |
| 🇮🇷 Iran | 3.6 |
| 🇧🇷 Brazil | 3.4 |
| 🇦🇪 UAE | 3.4 |
| 🇰🇼 Kuwait | 2.7 |
| 🌍 Other | 22.8 |
These three nations have consistently dominated oil production since 1971. The leading position, however, has alternated among them over the past five decades.
In contrast, the combined production of the next three largest producers—Canada, Iraq, and China—reached 13.1 million barrels per day in 2023, just surpassing the production of the United States alone.
In the near term, no country is likely to surpass the record production achieved by the U.S. in 2023, as no other producer has ever reached a daily capacity of 13.0 million barrels. Recently, Saudi Arabia’s state-owned Saudi Aramco scrapped plans to increase production capacity to 13.0 million barrels per day by 2027.
In 2024, analysts forecast that the U.S. will maintain its position as the top oil producer. In fact, according to Macquarie Group, U.S. oil production is expected to achieve a record pace of about 14 million barrels per day by the end of the year.
Energy Shift
How Much Does the U.S. Depend on Russian Uranium?
Despite a new uranium ban being discussed in Congress, the U.S. is still heavily dependent on Russian uranium.

How Much Does the U.S. Depend on Russian Uranium?
This was originally posted on our Voronoi app. Download the app for free on iOS or Android and discover incredible data-driven charts from a variety of trusted sources.
The U.S. House of Representatives recently passed a ban on imports of Russian uranium. The bill must pass the Senate before becoming law.
In this graphic, we visualize how much the U.S. relies on Russian uranium, based on data from the United States Energy Information Administration (EIA).
U.S. Suppliers of Enriched Uranium
After Russia invaded Ukraine, the U.S. imposed sanctions on Russian-produced oil and gas—yet Russian-enriched uranium is still being imported.
Currently, Russia is the largest foreign supplier of nuclear power fuel to the United States. In 2022, Russia supplied almost a quarter of the enriched uranium used to fuel America’s fleet of more than 90 commercial reactors.
| Country of enrichment service | SWU* | % |
|---|---|---|
| 🇺🇸 United States | 3,876 | 27.34% |
| 🇷🇺 Russia | 3,409 | 24.04% |
| 🇩🇪 Germany | 1,763 | 12.40% |
| 🇬🇧 United Kingdom | 1,593 | 11.23% |
| 🇳🇱 Netherlands | 1,303 | 9.20% |
| Other | 2,232 | 15.79% |
| Total | 14,176 | 100% |
SWU stands for “Separative Work Unit” in the uranium industry. It is a measure of the amount of work required to separate isotopes of uranium during the enrichment process. Source: U.S. Energy Information Administration
Most of the remaining uranium is imported from European countries, while another portion is produced by a British-Dutch-German consortium operating in the United States called Urenco.
Similarly, nearly a dozen countries around the world depend on Russia for more than half of their enriched uranium—and many of them are NATO-allied members and allies of Ukraine.
In 2023 alone, the U.S. nuclear industry paid over $800 million to Russia’s state-owned nuclear energy corporation, Rosatom, and its fuel subsidiaries.
It is important to note that 19% of electricity in the U.S. is powered by nuclear plants.
The dependency on Russian fuels dates back to the 1990s when the United States turned away from its own enrichment capabilities in favor of using down-blended stocks of Soviet-era weapons-grade uranium.
As part of the new uranium-ban bill, the Biden administration plans to allocate $2.2 billion for the expansion of uranium enrichment facilities in the United States.

-

 Electrification3 years ago
Ranked: The Top 10 EV Battery Manufacturers
-

 Electrification2 years ago
The Key Minerals in an EV Battery
-

 Real Assets3 years ago
The World’s Top 10 Gold Mining Companies
-

 Misc3 years ago
All the Metals We Mined in One Visualization
-

 Electrification3 years ago
The Biggest Mining Companies in the World in 2021
-

 Energy Shift2 years ago
What Are the Five Major Types of Renewable Energy?
-

 Electrification2 years ago
The World’s Largest Nickel Mining Companies
-

 Electrification2 years ago
Mapped: Solar Power by Country in 2021