

Misc
Who’s Still Buying Fossil Fuels From Russia?
The Largest Importers of Russian Fossil Fuels Since the War
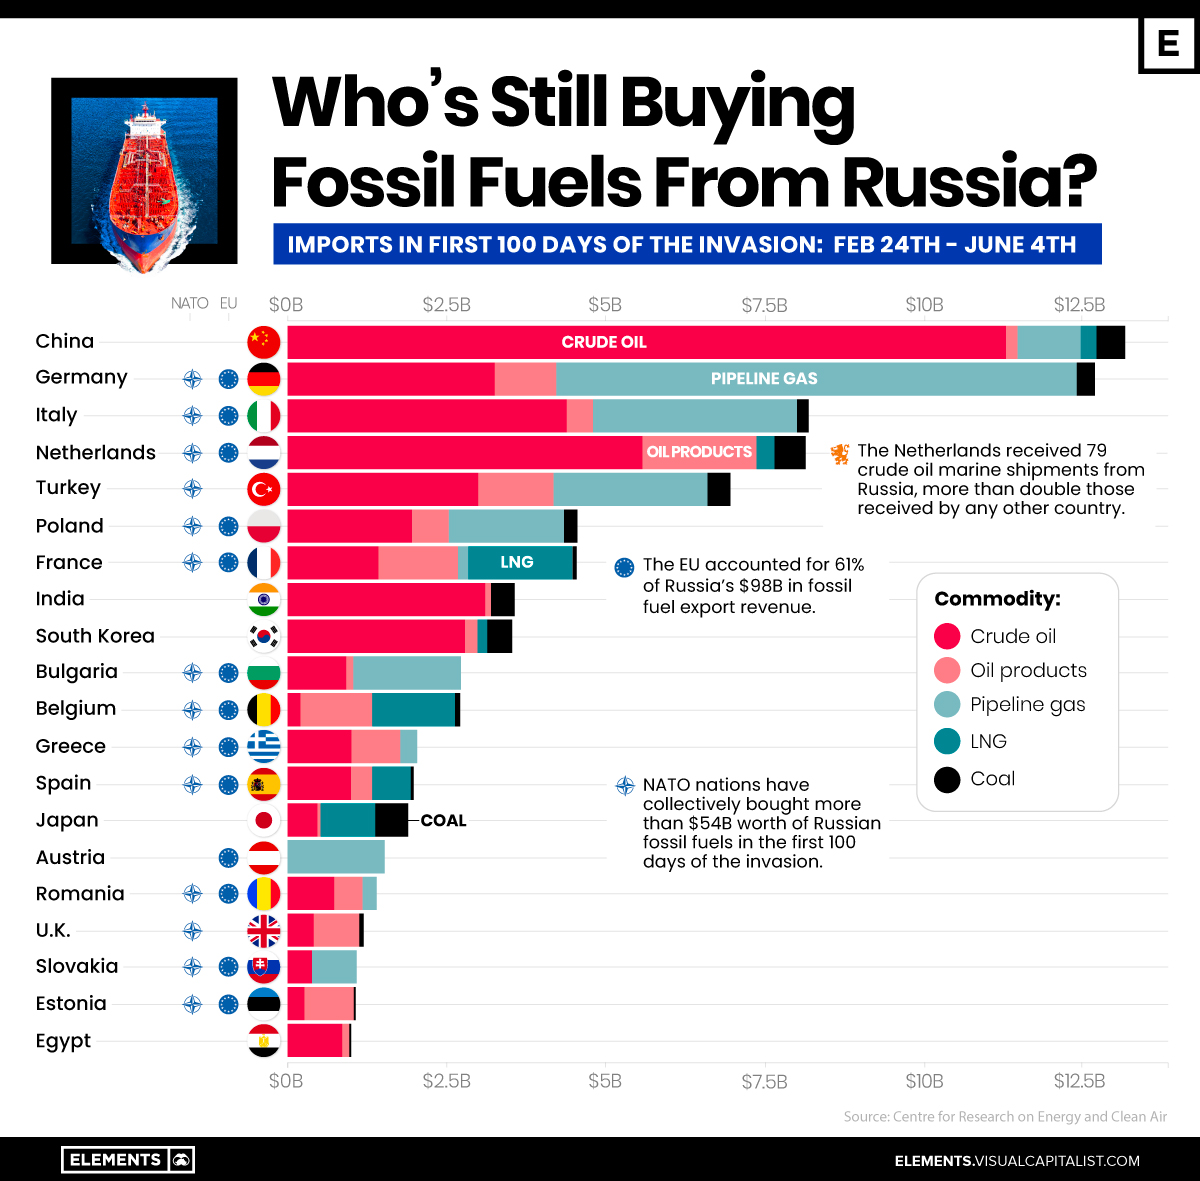
Despite looming sanctions and import bans, Russia exported $97.7 billion worth of fossil fuels in the first 100 days since its invasion of Ukraine, at an average of $977 million per day.
So, which fossil fuels are being exported by Russia, and who is importing these fuels?
The above infographic tracks the biggest importers of Russia’s fossil fuel exports during the first 100 days of the war based on data from the Centre for Research on Energy and Clean Air (CREA).
In Demand: Russia’s Black Gold
The global energy market has seen several cyclical shocks over the last few years.
The gradual decline in upstream oil and gas investment followed by pandemic-induced production cuts led to a drop in supply, while people consumed more energy as economies reopened and winters got colder. Consequently, fossil fuel demand was rising even before Russia’s invasion of Ukraine, which exacerbated the market shock.
Russia is the third-largest producer and second-largest exporter of crude oil. In the 100 days since the invasion, oil was by far Russia’s most valuable fossil fuel export, accounting for $48 billion or roughly half of the total export revenue.
| Fossil fuel | Revenue from exports (Feb 24 - June 4) | % of total Russian fossil fuel export revenue |
|---|---|---|
| Crude oil | $48.3B | 49.4% |
| Pipeline gas | $25.2B | 25.8% |
| Oil products | $13.6B | 13.9% |
| Liquified Natural Gas (LNG) | $5.4B | 5.5% |
| Coal | $5.0B | 5.1% |
| Total | $97.7B | 100% |
While Russian crude oil is shipped on tankers, a network of pipelines transports Russian gas to Europe. In fact, Russia accounts for 41% of all natural gas imports to the EU, and some countries are almost exclusively dependent on Russian gas. Of the $25 billion exported in pipeline gas, 85% went to the EU.
The Top Importers of Russian Fossil Fuels
The EU bloc accounted for 61% of Russia’s fossil fuel export revenue during the 100-day period.
Germany, Italy, and the Netherlands—members of both the EU and NATO—were among the largest importers, with only China surpassing them.
| Country | Value of fossil fuel imports from Russia (Feb 24 - June 4) | % of total Russian fossil fuel export revenue |
|---|---|---|
| China 🇨🇳 | $13.2B | 13.5% |
| Germany 🇩🇪 | $12.7B | 12.9% |
| Italy 🇮🇹 | $8.2B | 8.4% |
| Netherlands 🇳🇱 | $8.2B | 8.4% |
| Turkey 🇹🇷 | $7.0B | 7.2% |
| Poland 🇵🇱 | $4.6B | 4.7% |
| France 🇫🇷 | $4.5B | 4.6% |
| India 🇮🇳 | $3.6B | 3.7% |
| Other 🌍 | $35.7B | 36.5% |
| Total | $97.7B | 100% |
China overtook Germany as the largest importer, importing nearly 2 million barrels of discounted Russian oil per day in May—up 55% relative to a year ago. Similarly, Russia surpassed Saudi Arabia as China’s largest oil supplier.
The biggest increase in imports came from India, buying 18% of all Russian oil exports during the 100-day period. A significant amount of the oil that goes to India is re-exported as refined products to the U.S. and Europe, which are trying to become independent of Russian imports.
Reducing Reliance on Russia
In response to the invasion of Ukraine, several countries have taken strict action against Russia through sanctions on exports, including fossil fuels.
The U.S. and Sweden have banned Russian fossil fuel imports entirely, with monthly import volumes down 100% and 99% in May relative to when the invasion began, respectively.
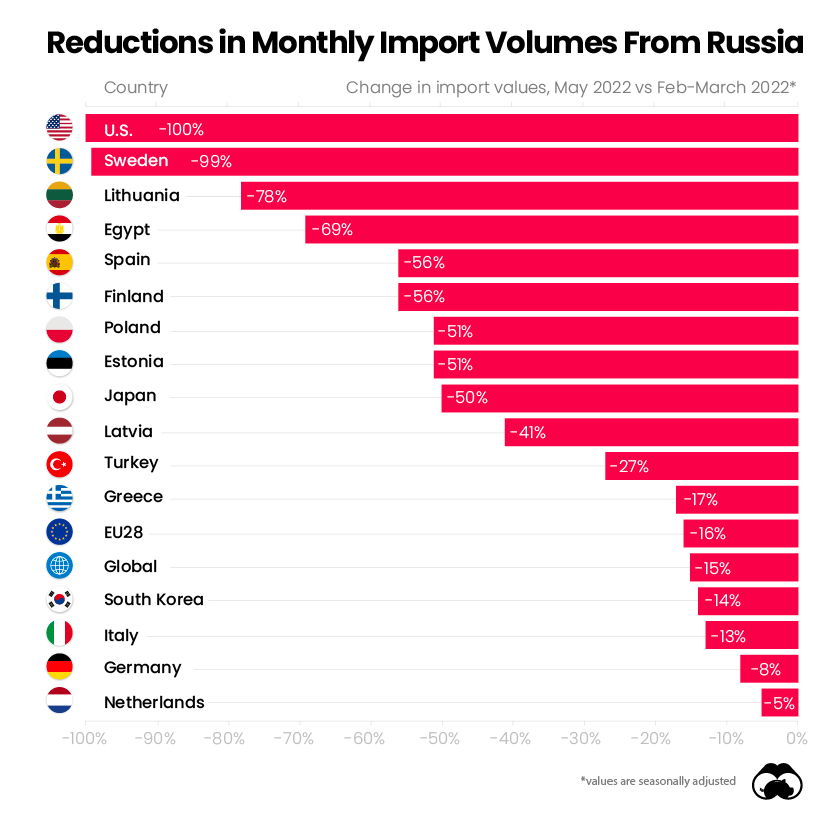
On a global scale, monthly fossil fuel import volumes from Russia were down 15% in May, an indication of the negative political sentiment surrounding the country.
It’s also worth noting that several European countries, including some of the largest importers over the 100-day period, have cut back on Russian fossil fuels. Besides the EU’s collective decision to reduce dependence on Russia, some countries have also refused the country’s ruble payment scheme, leading to a drop in imports.
The import curtailment is likely to continue. The EU recently adopted a sixth sanction package against Russia, placing a complete ban on all Russian seaborne crude oil products. The ban, which covers 90% of the EU’s oil imports from Russia, will likely realize its full impact after a six-to-eight month period that permits the execution of existing contracts.
While the EU is phasing out Russian oil, several European countries are heavily reliant on Russian gas. A full-fledged boycott on Russia’s fossil fuels would also hurt the European economy—therefore, the phase-out will likely be gradual, and subject to the changing geopolitical environment.


Misc
Brass Rods: The Secure Choice
This graphic shows why brass rods are the secure choice for precision-machined and forged parts.

Brass Rods: The Secure Choice
The unique combination of machinability and recyclability makes brass rods the secure choice for manufacturers seeking future-proof raw material solutions.
This infographic, from the Copper Development Association, shows three ways brass rods give manufacturers greater control and a license to grow in the competitive market for precision-machined and forged products.
Future-Proof Investments in New Machine Tools
A material’s machinability directly impacts machine throughput, which typically has the largest impact on machine shop profitability.
The high-speed machining capabilities of brass rods maximize machine tool performance, allowing manufacturers to run the material faster and longer without sacrificing tool life, chip formation, or surface quality.
The high machining efficiency of brass leads to reduced per-part costs, quicker return on investment (ROI) for new machine tools, and expanded production capacity for new projects.
Supply Security Through Closed Loop Recycling
Brass, like its parent element copper, can be infinitely recycled.
In 2022, brass- and wire-rod mills accounted for the majority of the 830,000 tonnes of copper recycled from scrap in the U.S.
Given that scrap ratios for machined parts typically range from 60-70% by weight, producing mills benefit from a secure and steady supply of clean scrap returned directly from customers, which is recycled to create new brass rods.
The high residual value of brass scrap creates a strong recycling incentive. Scrap buy back programs give manufacturers greater control over raw material net costs as scrap value is often factored into supplier purchase agreements.
Next Generation Alloys for a Lead-Free Future
Increasingly stringent global regulations continue to pressure manufacturers to minimize the use of materials containing trace amounts of lead and other harmful impurities.
The latest generation of brass-rod alloys is engineered to meet the most demanding criteria for lead leaching in drinking water and other sensitive applications.
Seven brass-rod alloys passed rigorous testing to become the only ‘Acceptable Materials’ against lower lead leaching criteria recently adopted in the national U.S. drinking water quality standard, NSF 61.
Learn more about the advantages of brass rods solutions.
Misc
Brass Rods: The Safe Choice
From airbags to firefighting equipment, components made from brass rods play a vital role in creating a safer environment.

Brass Rods: The Safe Choice
From airbags to firefighting equipment, components made from brass rods play a vital role in creating a safer environment.
This infographic from the Copper Development Association illustrates three use cases for brass. This is the first of three infographics in our Choose Brass series.
Why Brass?
Brass is one of the most reliable metals for industrial and other applications. It contains little to no iron, protecting it from oxidation, which can cause other materials to fail over time.
Additionally, the malleability of brass ensures tight and leak-free metal-to-metal seals for threaded joints, minimizing the risk of costly and dangerous system failures. Brass’s durability ensures critical system components function properly for years.
Brass for Safe Water Systems
Exposure to lead in water can cause various health problems, including neurological damage, developmental delays, and cardiovascular diseases.
As a result, the U.S. sets minimum health-effect requirements for chemical contaminants and impurities indirectly transferred to drinking water from products, components, and materials used in water systems.
Currently, only brass rod alloys are designated as “acceptable materials” according to national standards.
Brass is also essential for ensuring workplace safety, particularly in high-risk manufacturing environments.
Using Brass for Safe Manufacturing and Industrial Environments
Brass is used extensively in industrial applications such as machinery components, valves, fittings, architectural elements, bearings, and gears.
The machinability of brass rods also means longer tool life and higher productivity for manufacturers of precision parts.
The microstructure of brass helps break up metal chips generated during machining operations, preventing long and stringy chips that can crash machines and seriously injure operators.
Additionally, brass’s non-sparking properties make it ideal for tooling, fittings, and components in high-risk industries such as oil & gas, chemicals, pharmaceuticals, paint manufacturing, power plants, and explosives.
Brass for Safer Communities
Many pieces of equipment in our daily lives also rely on brass rod parts to function. Control valves in gas stoves, BBQs, and home furnaces made from brass rods reduce the risk of deadly gas leaks and fires.
Moreover, brass is ideal for firefighting equipment due to its corrosion resistance, durability, heat resistance, and non-sparking properties.
Fittings made from brass rods ensure that the brakes and airbags in our vehicles work when needed.
Brass and other copper-based alloys are also naturally antimicrobial, helping prevent diseases when used in high-touch surfaces such as door handles.
These are only some of the ways that brass rods help build a safer world for everyone.
Explore the Advantages of Brass Rod Solutions.

-

 Electrification3 years ago
Ranked: The Top 10 EV Battery Manufacturers
-

 Electrification2 years ago
The Key Minerals in an EV Battery
-

 Real Assets3 years ago
The World’s Top 10 Gold Mining Companies
-

 Misc3 years ago
All the Metals We Mined in One Visualization
-

 Electrification3 years ago
The Biggest Mining Companies in the World in 2021
-

 Energy Shift2 years ago
What Are the Five Major Types of Renewable Energy?
-

 Electrification2 years ago
Mapped: Solar Power by Country in 2021
-

 Electrification2 years ago
The World’s Largest Nickel Mining Companies