

Misc
Explainer: What Key Factors Influence Gas Prices?
Explainer: What Key Factors Influence Gas Prices?
Across the United States, the cost of gas has been a hot topic of conversation lately, as prices reach record-breaking highs.
The national average now sits at $5.00 per gallon, and by the end of summer, this figure could grow to $6 per gallon, according to estimates by JPMorgan.
But before we can have an understanding of what’s happening at the pump, it’s important to first know what key factors dictate the price of gas.
This graphic, using data from the U.S. Energy Information Administration (EIA), outlines the main components that influence gas prices, providing each factor’s proportional impact on price.
The Four Main Factors
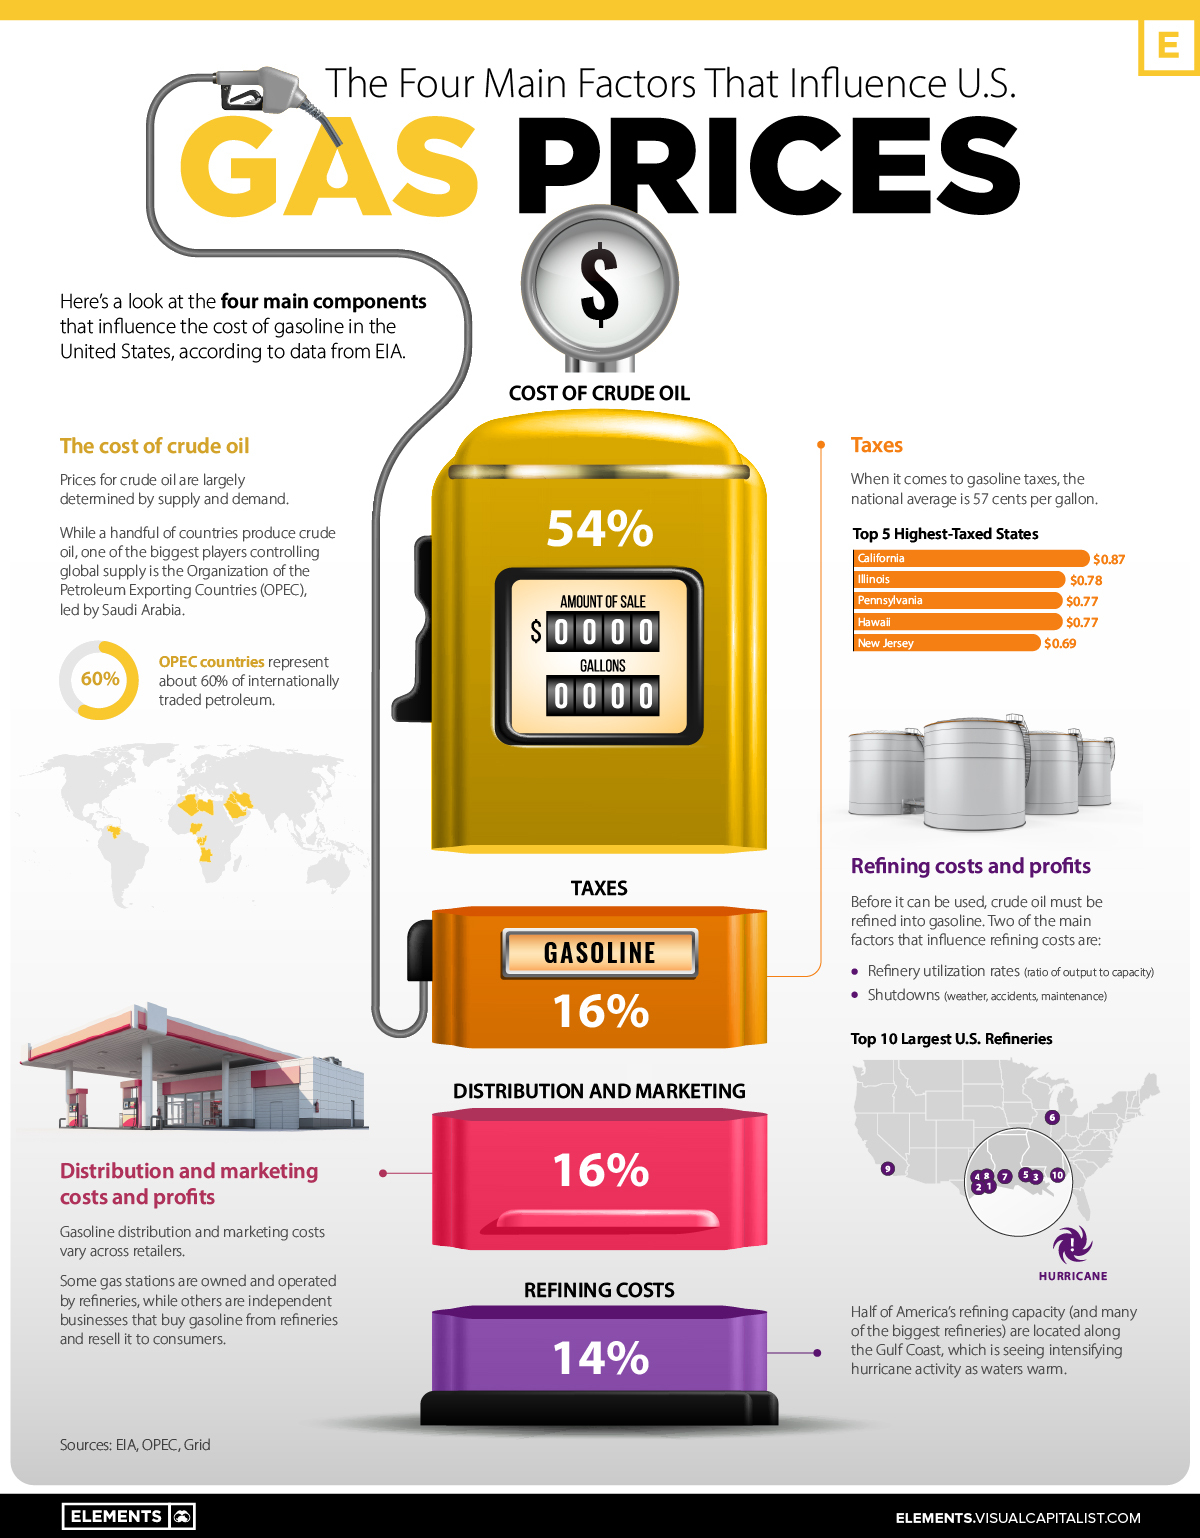
According to the EIA, there are four main factors that influence the price of gas:
- Crude oil prices (54%)
- Refining costs (14%)
- Taxes (16%)
- Distribution, and marketing costs (16%)
More than half the cost of filling your tank is influenced by the price of crude oil. Meanwhile, the rest of the price at the pump is split fairly equally between refining costs, marketing and distribution, and taxes.
Let’s look at each factor in more depth.
Crude Oil Prices
The most influential factor is the cost of crude oil, which is largely dictated by international supply and demand.
Despite being the world’s largest oil producer, the U.S. remains a net importer of crude oil, with the majority coming from Canada, Mexico, and Saudi Arabia. Because of America’s reliance on imports, U.S. gas prices are largely influenced by the global crude oil market.
A number of geopolitical factors can influence the crude oil market, but one of the biggest influences is the Organization of the Petroleum Exporting Countries (OPEC), led by Saudi Arabia.
Established in 1960, OPEC was created to combat U.S. dominance of the global oil market. OPEC sets production targets for its 13 member countries, and historically, oil prices have been linked to changes in OPEC production. Today, OPEC countries are responsible for about 60% of internationally traded petroleum.
Refining Costs
Oil needs to be refined into gasoline before it can be used by consumers, which is why refining costs are factored into the price of gas.
The U.S. has hundreds of refineries across the country. The country’s largest refinery, owned by the Saudi Arabian company Saudi Aramco, processes around 607,000 barrels of oil per day.
The exact cost of refining varies, depending on a number of factors such as the type of crude oil used, the processing technology available at the refinery, and the gasoline requirements in specific parts of the country.
In general, refining capacity in the U.S. has not been keeping up with oil demand. Several refineries shut down throughout the pandemic, but even before COVID-19, refining capacity in the U.S. was lagging behind demand. Incredibly, there haven’t been any brand-new refining facilities built in the country since 1977.
Taxes
In the U.S., taxes also play a critical role in determining the price of gas.
Across America, the average gasoline tax is $0.57 per gallon, however, the exact amount fluctuates from state to state. Here’s a look at the top five states with the highest gas taxes:
| Rank | State | Gas tax (per gallon) |
|---|---|---|
| 1 | California | $0.87 |
| 2 | Illinois | $0.78 |
| 3 | Pennsylvania | $0.77 |
| 4 | Hawaii | $0.77 |
| 5 | New Jersey | $0.69 |
*Note: figures include both state and federal tax
States with high gas taxes usually spend the extra money on improvements to their infrastructure or local transportation. For instance, Illinois doubled its gas taxes in 2019 as part of a $45 billion infrastructure plan.
California, the state with the highest tax on gas, is expecting to see a rate increase this July, which will drive gas prices up by around three cents per gallon.
Distribution and Marketing Costs
Lastly, the costs of distribution and marketing have an impact on the price of gas.
Gasoline is typically shipped from refineries to local terminals via pipelines. From there, the gasoline is processed further to ensure it meets market requirements or local government standards.
Gas stations then distribute the final product to the consumer. The cost of running a gas station varies—some gas stations are owned and operated by brand-name refineries like Chevron, while others are smaller-scale operations owned by independent merchants.
The big-name brands run a lot of advertisements. According to Morning Consult, Chevron, BP PLC, Exxon Mobil Corp., and Royal Dutch Shell PLC aired TV advertisements in the U.S. more than 44,495 times between June 1, 2020, and Aug. 31, 2021.
How Does the Russia-Ukraine Conflict Impact U.S. Gas Prices?
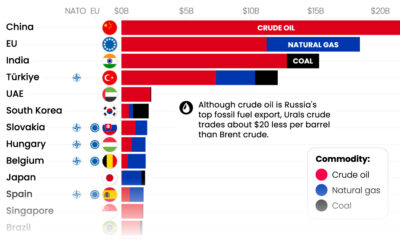
If only a fraction of America’s oil comes from Russia, why is the Russia-Ukraine conflict impacting prices in the U.S.?
Because oil is bought and sold on a global commodities market. So, when countries imposed sanctions on Russian oil, that put a squeeze on global supply, which ultimately drove up prices.
This supply shock could keep prices high for a while unless the U.S. falls into a recession, which is a growing possibility based on how recent data is trending.


Misc
Brass Rods: The Secure Choice
This graphic shows why brass rods are the secure choice for precision-machined and forged parts.

Brass Rods: The Secure Choice
The unique combination of machinability and recyclability makes brass rods the secure choice for manufacturers seeking future-proof raw material solutions.
This infographic, from the Copper Development Association, shows three ways brass rods give manufacturers greater control and a license to grow in the competitive market for precision-machined and forged products.
Future-Proof Investments in New Machine Tools
A material’s machinability directly impacts machine throughput, which typically has the largest impact on machine shop profitability.
The high-speed machining capabilities of brass rods maximize machine tool performance, allowing manufacturers to run the material faster and longer without sacrificing tool life, chip formation, or surface quality.
The high machining efficiency of brass leads to reduced per-part costs, quicker return on investment (ROI) for new machine tools, and expanded production capacity for new projects.
Supply Security Through Closed Loop Recycling
Brass, like its parent element copper, can be infinitely recycled.
In 2022, brass- and wire-rod mills accounted for the majority of the 830,000 tonnes of copper recycled from scrap in the U.S.
Given that scrap ratios for machined parts typically range from 60-70% by weight, producing mills benefit from a secure and steady supply of clean scrap returned directly from customers, which is recycled to create new brass rods.
The high residual value of brass scrap creates a strong recycling incentive. Scrap buy back programs give manufacturers greater control over raw material net costs as scrap value is often factored into supplier purchase agreements.
Next Generation Alloys for a Lead-Free Future
Increasingly stringent global regulations continue to pressure manufacturers to minimize the use of materials containing trace amounts of lead and other harmful impurities.
The latest generation of brass-rod alloys is engineered to meet the most demanding criteria for lead leaching in drinking water and other sensitive applications.
Seven brass-rod alloys passed rigorous testing to become the only ‘Acceptable Materials’ against lower lead leaching criteria recently adopted in the national U.S. drinking water quality standard, NSF 61.
Learn more about the advantages of brass rods solutions.
Misc
Brass Rods: The Safe Choice
From airbags to firefighting equipment, components made from brass rods play a vital role in creating a safer environment.

Brass Rods: The Safe Choice
From airbags to firefighting equipment, components made from brass rods play a vital role in creating a safer environment.
This infographic from the Copper Development Association illustrates three use cases for brass. This is the first of three infographics in our Choose Brass series.
Why Brass?
Brass is one of the most reliable metals for industrial and other applications. It contains little to no iron, protecting it from oxidation, which can cause other materials to fail over time.
Additionally, the malleability of brass ensures tight and leak-free metal-to-metal seals for threaded joints, minimizing the risk of costly and dangerous system failures. Brass’s durability ensures critical system components function properly for years.
Brass for Safe Water Systems
Exposure to lead in water can cause various health problems, including neurological damage, developmental delays, and cardiovascular diseases.
As a result, the U.S. sets minimum health-effect requirements for chemical contaminants and impurities indirectly transferred to drinking water from products, components, and materials used in water systems.
Currently, only brass rod alloys are designated as “acceptable materials” according to national standards.
Brass is also essential for ensuring workplace safety, particularly in high-risk manufacturing environments.
Using Brass for Safe Manufacturing and Industrial Environments
Brass is used extensively in industrial applications such as machinery components, valves, fittings, architectural elements, bearings, and gears.
The machinability of brass rods also means longer tool life and higher productivity for manufacturers of precision parts.
The microstructure of brass helps break up metal chips generated during machining operations, preventing long and stringy chips that can crash machines and seriously injure operators.
Additionally, brass’s non-sparking properties make it ideal for tooling, fittings, and components in high-risk industries such as oil & gas, chemicals, pharmaceuticals, paint manufacturing, power plants, and explosives.
Brass for Safer Communities
Many pieces of equipment in our daily lives also rely on brass rod parts to function. Control valves in gas stoves, BBQs, and home furnaces made from brass rods reduce the risk of deadly gas leaks and fires.
Moreover, brass is ideal for firefighting equipment due to its corrosion resistance, durability, heat resistance, and non-sparking properties.
Fittings made from brass rods ensure that the brakes and airbags in our vehicles work when needed.
Brass and other copper-based alloys are also naturally antimicrobial, helping prevent diseases when used in high-touch surfaces such as door handles.
These are only some of the ways that brass rods help build a safer world for everyone.
Explore the Advantages of Brass Rod Solutions.

-

 Electrification3 years ago
Ranked: The Top 10 EV Battery Manufacturers
-

 Electrification2 years ago
The Key Minerals in an EV Battery
-

 Real Assets3 years ago
The World’s Top 10 Gold Mining Companies
-

 Misc3 years ago
All the Metals We Mined in One Visualization
-

 Electrification3 years ago
The Biggest Mining Companies in the World in 2021
-

 Energy Shift2 years ago
What Are the Five Major Types of Renewable Energy?
-

 Electrification2 years ago
Mapped: Solar Power by Country in 2021
-

 Electrification2 years ago
The World’s Largest Nickel Mining Companies