

Misc
The Elemental Composition of the Human Body


The Elemental Composition of a Human Body
The human body is a miraculous, well-oiled, and exceptionally complex machine. It requires a multitude of functioning parts to come together for a person to live a healthy life—and every biological detail in our bodies, from the mundane to the most magical, is driven by just 21 chemical elements.
Of the 118 elements on Earth, just 21 of them are found in the human body. Together, they make up the medley of divergent molecules that combine to form our DNA, cells, tissues, and organs.
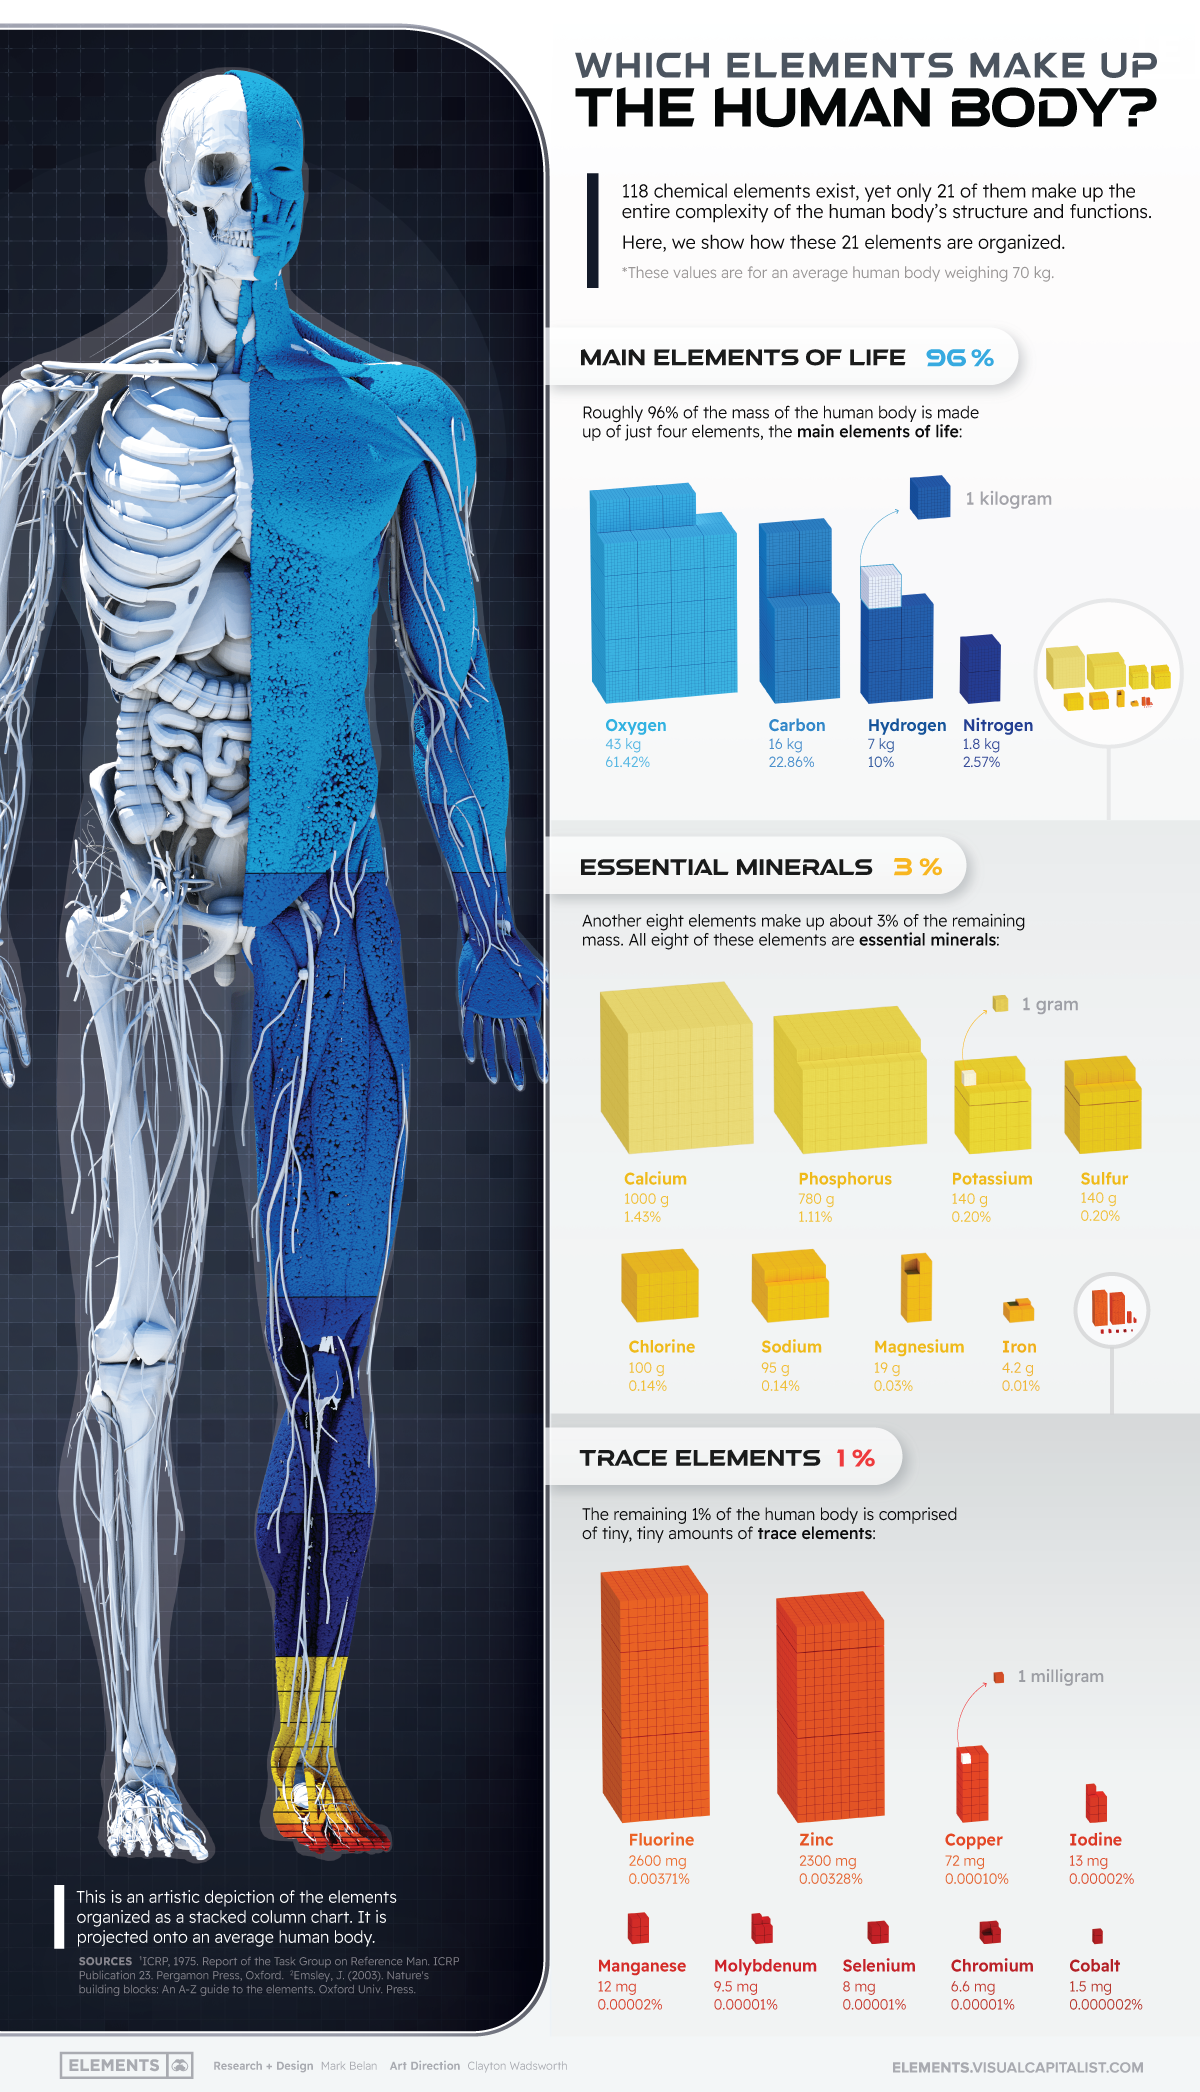
Based on data presented by the International Commission on Radiological Protection (ICRP), in the above infographic, we have broken down a human body to its elemental composition and the percentages in which they exist.
These 21 elements can be categorized into three major blocks depending on the amount found in a human body, the main building block (4 elements), essential minerals (8 elements), and trace elements (9 elements).
The Elemental Four: Ingredients for Life
Four elements, namely, oxygen, carbon, hydrogen, and nitrogen, are considered the most essential elements found in our body.
Oxygen is the most abundant element in the human body, accounting for approximately 61% of a person’s mass. Given that around 60-70% of the body is water, it is no surprise that oxygen and hydrogen are two of the body’s most abundantly found chemical elements. Along with carbon and nitrogen, these elements combine for 96% of the body’s mass.
Here is a look at the composition of the four elements of life:
| Element | Weight of Body Mass (kg) | Percentage of Body Mass (%) |
|---|---|---|
| Oxygen | 43 kg | 61.4% |
| Carbon | 16 kg | 22.9% |
| Hydrogen | 7.0 kg | 10.0% |
| Nitrogen | 1.8 kg | 2.6% |
Values are for an average human body weighing 70 kg.
Let’s take a look at how each of these four chemical elements contributes to the thriving functionality of our body:
Oxygen
Oxygen plays a critical role in the body’s metabolism, respiration, and cellular oxygenation. Oxygen is also found in every significant organic molecule in the body, including proteins, carbohydrates, fats, and nucleic acids. It is a substantial component of everything from our cells and blood to our cerebral and spinal fluid.
Carbon
Carbon is the most crucial structural element and the reason we are known as carbon-based life forms. It is the basic building block required to form proteins, carbohydrates, and fats. Breaking carbon bonds in carbohydrates and proteins is our primary energy source.
Hydrogen
Hydrogen, the most abundantly found chemical element in the universe, is present in all bodily fluids, allowing the toxins and waste to be transported and eliminated. With the help of hydrogen, joints in our body remain lubricated and able to perform their functions. Hydrogen is also said to have anti-inflammatory and antioxidant properties, helping improve muscle function.
Nitrogen
An essential component of amino acids used to build peptides and proteins is nitrogen. It is also an integral component of the nucleic acids DNA and RNA, the chemical backbone of our genetic information and genealogy.
Essential and Supplemental Minerals
Essential minerals are important for your body to stay healthy. Your body uses minerals for several processes, including keeping your bones, muscles, heart, and brain working properly. Minerals also control beneficial enzyme and hormone production.
Minerals like calcium are a significant component of our bones and are required for bone growth and development, along with muscle contractions. Phosphorus contributes to bone and tooth strength and is vital to metabolizing energy.
Here is a look at the elemental composition of essential minerals:
| Element | Weight of Body Mass (g) | Percentage of Body Mass (%) |
|---|---|---|
| Calcium | 1000 g | 1.43% |
| Phosphorus | 780 g | 1.11% |
| Potassium | 140 g | 0.20% |
| Sulphur | 140 g | 0.20% |
| Chlorine | 100 g | 0.14% |
| Sodium | 95 g | 0.14% |
| Magnesium | 19 g | 0.03% |
| Iron | 4.2 g | 0.01% |
Values are for an average human body weighing 70 kg.
Other macro-minerals like magnesium, potassium, iron, and sodium are essential for cell-to-cell communications, like electric transmissions that generate nerve impulses or heart rhythms, and are necessary for maintaining thyroid and bone health.
Excessive deficiency of any of these minerals can cause various disorders in your body. Most humans receive these minerals as a part of their daily diet, including vegetables, meat, legumes, and fruits. In case of deficiencies, though, these minerals are also prescribed as supplements.
Biological Composition of Trace Elements
Trace elements or trace metals are small amounts of minerals found in living tissues. Some of them are known to be nutritionally essential, while others may be considered to be nonessential. They are usually in minimal quantities in our body and make up only 1% of our mass.
Paramount among these are trace elements such as zinc, copper, manganese, and fluorine. Zinc works as a first responder against infections and thereby improves infection resistance, while balancing the immune response.
Here is the distribution of trace elements in our body:
| Element | Weight of Body Mass (mg) | Percentage of Body Mass (%) |
|---|---|---|
| Fluorine | 2600 mg | 0.00371% |
| Zinc | 2300 mg | 0.00328% |
| Copper | 72 mg | 0.00010% |
| Iodine | 13 mg | 0.00002% |
| Manganese | 12 mg | 0.00002% |
| Molybdenum | 9.5 mg | 0.00001% |
| Selenium | 8 mg | 0.00001% |
| Chromium | 6.6 mg | 0.00001% |
| Cobalt | 1.5 mg | 0.000002% |
Values are for an average human body weighing 70 kg.
Even though only it’s found in trace quantities, copper is instrumental in forming red blood cells and keeping nerve cells healthy. It also helps form collagen, a crucial part of bones and connective tissue.
Even with constant research and studies performed to thoroughly understand these trace elements’ uses and benefits, scientists and researchers are constantly making new discoveries.
For example, recent research shows that some of these trace elements could be used to cure and fight chronic and debilitating diseases ranging from ischemia to cancer, cardiovascular disease, and hypertension.


Misc
Brass Rods: The Secure Choice
This graphic shows why brass rods are the secure choice for precision-machined and forged parts.

Brass Rods: The Secure Choice
The unique combination of machinability and recyclability makes brass rods the secure choice for manufacturers seeking future-proof raw material solutions.
This infographic, from the Copper Development Association, shows three ways brass rods give manufacturers greater control and a license to grow in the competitive market for precision-machined and forged products.
Future-Proof Investments in New Machine Tools
A material’s machinability directly impacts machine throughput, which typically has the largest impact on machine shop profitability.
The high-speed machining capabilities of brass rods maximize machine tool performance, allowing manufacturers to run the material faster and longer without sacrificing tool life, chip formation, or surface quality.
The high machining efficiency of brass leads to reduced per-part costs, quicker return on investment (ROI) for new machine tools, and expanded production capacity for new projects.
Supply Security Through Closed Loop Recycling
Brass, like its parent element copper, can be infinitely recycled.
In 2022, brass- and wire-rod mills accounted for the majority of the 830,000 tonnes of copper recycled from scrap in the U.S.
Given that scrap ratios for machined parts typically range from 60-70% by weight, producing mills benefit from a secure and steady supply of clean scrap returned directly from customers, which is recycled to create new brass rods.
The high residual value of brass scrap creates a strong recycling incentive. Scrap buy back programs give manufacturers greater control over raw material net costs as scrap value is often factored into supplier purchase agreements.
Next Generation Alloys for a Lead-Free Future
Increasingly stringent global regulations continue to pressure manufacturers to minimize the use of materials containing trace amounts of lead and other harmful impurities.
The latest generation of brass-rod alloys is engineered to meet the most demanding criteria for lead leaching in drinking water and other sensitive applications.
Seven brass-rod alloys passed rigorous testing to become the only ‘Acceptable Materials’ against lower lead leaching criteria recently adopted in the national U.S. drinking water quality standard, NSF 61.
Learn more about the advantages of brass rods solutions.
Misc
Brass Rods: The Safe Choice
From airbags to firefighting equipment, components made from brass rods play a vital role in creating a safer environment.

Brass Rods: The Safe Choice
From airbags to firefighting equipment, components made from brass rods play a vital role in creating a safer environment.
This infographic from the Copper Development Association illustrates three use cases for brass. This is the first of three infographics in our Choose Brass series.
Why Brass?
Brass is one of the most reliable metals for industrial and other applications. It contains little to no iron, protecting it from oxidation, which can cause other materials to fail over time.
Additionally, the malleability of brass ensures tight and leak-free metal-to-metal seals for threaded joints, minimizing the risk of costly and dangerous system failures. Brass’s durability ensures critical system components function properly for years.
Brass for Safe Water Systems
Exposure to lead in water can cause various health problems, including neurological damage, developmental delays, and cardiovascular diseases.
As a result, the U.S. sets minimum health-effect requirements for chemical contaminants and impurities indirectly transferred to drinking water from products, components, and materials used in water systems.
Currently, only brass rod alloys are designated as “acceptable materials” according to national standards.
Brass is also essential for ensuring workplace safety, particularly in high-risk manufacturing environments.
Using Brass for Safe Manufacturing and Industrial Environments
Brass is used extensively in industrial applications such as machinery components, valves, fittings, architectural elements, bearings, and gears.
The machinability of brass rods also means longer tool life and higher productivity for manufacturers of precision parts.
The microstructure of brass helps break up metal chips generated during machining operations, preventing long and stringy chips that can crash machines and seriously injure operators.
Additionally, brass’s non-sparking properties make it ideal for tooling, fittings, and components in high-risk industries such as oil & gas, chemicals, pharmaceuticals, paint manufacturing, power plants, and explosives.
Brass for Safer Communities
Many pieces of equipment in our daily lives also rely on brass rod parts to function. Control valves in gas stoves, BBQs, and home furnaces made from brass rods reduce the risk of deadly gas leaks and fires.
Moreover, brass is ideal for firefighting equipment due to its corrosion resistance, durability, heat resistance, and non-sparking properties.
Fittings made from brass rods ensure that the brakes and airbags in our vehicles work when needed.
Brass and other copper-based alloys are also naturally antimicrobial, helping prevent diseases when used in high-touch surfaces such as door handles.
These are only some of the ways that brass rods help build a safer world for everyone.
Explore the Advantages of Brass Rod Solutions.

-

 Electrification3 years ago
Ranked: The Top 10 EV Battery Manufacturers
-

 Electrification2 years ago
The Key Minerals in an EV Battery
-

 Real Assets3 years ago
The World’s Top 10 Gold Mining Companies
-

 Misc3 years ago
All the Metals We Mined in One Visualization
-

 Electrification3 years ago
The Biggest Mining Companies in the World in 2021
-

 Energy Shift2 years ago
What Are the Five Major Types of Renewable Energy?
-

 Electrification2 years ago
Mapped: Solar Power by Country in 2021
-

 Electrification2 years ago
The World’s Largest Nickel Mining Companies