

Energy Shift
Ranked: The Top 10 Countries by Energy Transition Investment
Ranked: The Top 10 Countries by Energy Transition Investment
More than 130 countries have set or are considering a goal of net-zero emissions by 2050.
Achieving net-zero on a global scale, however, requires $125 trillion in climate investment by 2050, according to research commissioned by the United Nations Framework Convention on Climate Change (UNFCCC).
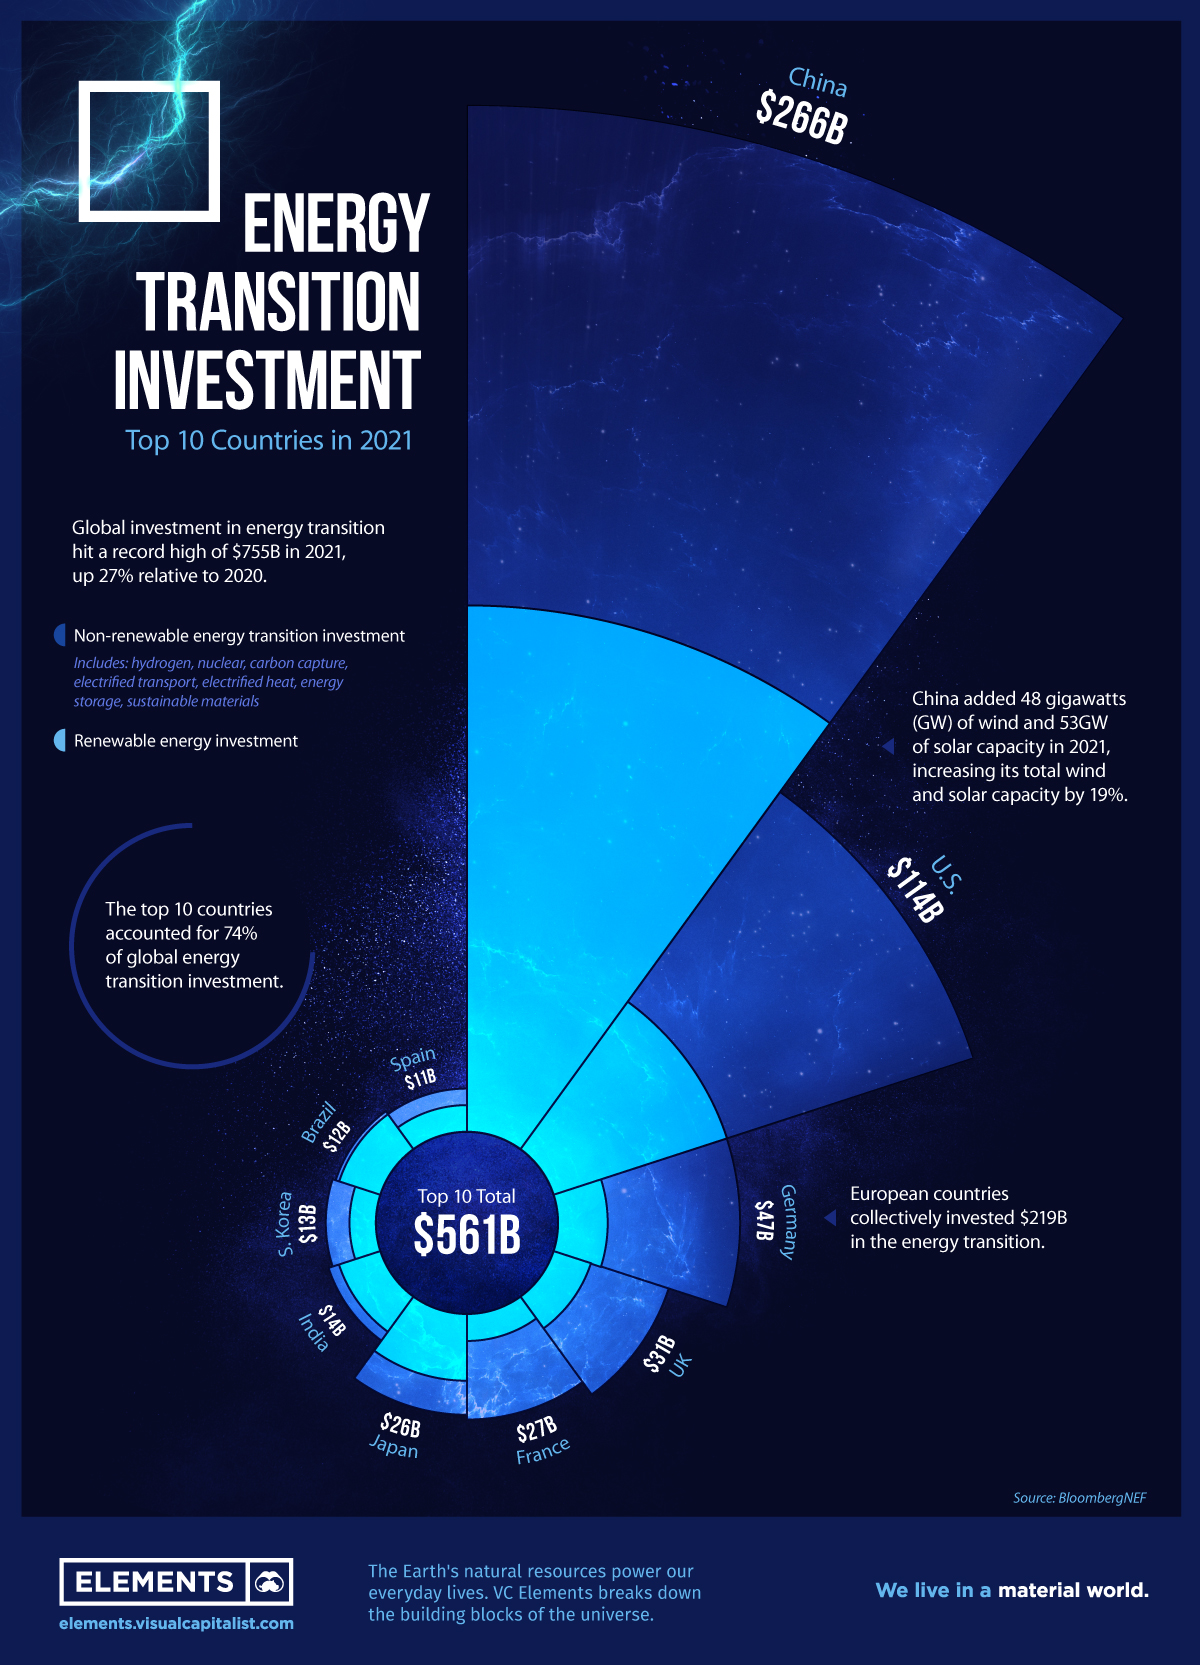
While that level of investment hasn’t been achieved yet, it’s ramping up. In 2021, the world spent $755 billion on deploying low-carbon energy technologies, up 27% from the year prior.
This graphic highlights the top 10 countries by low-carbon energy investment in 2021 using data from BloombergNEF.
Energy Transition Investment by Country
The top 10 countries together invested $561 billion in the energy transition, nearly three-fourths of the world total.
| Country | 2021 Energy Transition Investment (US$) | % of World Total |
|---|---|---|
| China 🇨🇳 | $266B | 35.2% |
| U.S. 🇺🇸 | $114B | 15.1% |
| Germany 🇩🇪 | $47B | 6.2% |
| U.K. 🇬🇧 | $31B | 4.1% |
| France 🇫🇷 | $27B | 3.6% |
| Japan 🇯🇵 | $26B | 3.4% |
| India 🇮🇳 | $14B | 1.9% |
| South Korea 🇰🇷 | $13B | 1.7% |
| Brazil 🇧🇷 | $12B | 1.6% |
| Spain 🇪🇸 | $11B | 1.5% |
| Total | $561B | 74.3% |
China increased its overall energy transition investment by 60% from 2020 levels, further cementing its position as a global leader. The country’s wind and solar capacity increased by 19% in 2021, with electrified transport also accounting for a large portion of the investment.
Next, the U.S. invested $114 billion in clean energy last year, up 17% from 2020. Several European countries also made the top 10 list, with Germany, U.K., and France rounding out the top five. In total, European countries invested $219 billion in the energy transition.
Which Low-Carbon Technologies are Attracting Investment?
While the top 10 countries provide an overview of where investments are being made, it’s also interesting to see which sectors are seeing the biggest influxes of capital.
Here’s a breakdown of energy transition investment by sector in 2021:
| Technology/Sector | Total Investment in 2021 (US$) | % change from 2020 |
|---|---|---|
| Renewable energy | $365.9B | 6.8% |
| Electrified transport | $273.2B | 76.7% |
| Electrified heat | $52.7B | 10.7% |
| Nuclear | $31.5B | 6.1% |
| Sustainable Materials | $19.3B | 141.3% |
| Energy Storage | $7.9B | -6.0% |
| Carbon capture & storage | $2.3B | -23.3% |
| Hydrogen | $2.0B | 33.3% |
| Total | $754.8B | 26.8% |
Renewables accounted for nearly 50% of total investment in 2021. However, electrified transport drove much of the growth as several countries charged ahead in the shift to electric vehicles.
Nuclear power also racked up roughly $32 billion in investments, as conviction grows that it can deliver reliable, carbon-free electricity. But the biggest overall percentage gain was seen in sustainable materials including recycling and bioplastics, which saw investment activity more than double in 2021.
Given that the dawn of clean energy is still in its early hours, technologies in the sector are constantly evolving. As the race to net-zero continues, which energy technologies will draw even more investment in the future?


Energy Shift
The World’s Biggest Oil Producers in 2023
Just three countries accounted for 40% of global oil production last year.

The World’s Biggest Oil Producers in 2023
This was originally posted on our Voronoi app. Download the app for free on iOS or Android and discover incredible data-driven charts from a variety of trusted sources.
Despite efforts to decarbonize the global economy, oil still remains one of the world’s most important resources. It’s also produced by a fairly limited group of countries, which can be a source of economic and political leverage.
This graphic illustrates global crude oil production in 2023, measured in million barrels per day, sourced from the U.S. Energy Information Administration (EIA).
Three Countries Account for 40% of Global Oil Production
In 2023, the United States, Russia, and Saudi Arabia collectively contributed 32.7 million barrels per day to global oil production.
| Oil Production 2023 | Million barrels per day |
|---|---|
| 🇺🇸 U.S. | 12.9 |
| 🇷🇺 Russia | 10.1 |
| 🇸🇦 Saudi Arabia | 9.7 |
| 🇨🇦 Canada | 4.6 |
| 🇮🇶 Iraq | 4.3 |
| 🇨🇳 China | 4.2 |
| 🇮🇷 Iran | 3.6 |
| 🇧🇷 Brazil | 3.4 |
| 🇦🇪 UAE | 3.4 |
| 🇰🇼 Kuwait | 2.7 |
| 🌍 Other | 22.8 |
These three nations have consistently dominated oil production since 1971. The leading position, however, has alternated among them over the past five decades.
In contrast, the combined production of the next three largest producers—Canada, Iraq, and China—reached 13.1 million barrels per day in 2023, just surpassing the production of the United States alone.
In the near term, no country is likely to surpass the record production achieved by the U.S. in 2023, as no other producer has ever reached a daily capacity of 13.0 million barrels. Recently, Saudi Arabia’s state-owned Saudi Aramco scrapped plans to increase production capacity to 13.0 million barrels per day by 2027.
In 2024, analysts forecast that the U.S. will maintain its position as the top oil producer. In fact, according to Macquarie Group, U.S. oil production is expected to achieve a record pace of about 14 million barrels per day by the end of the year.
Energy Shift
How Much Does the U.S. Depend on Russian Uranium?
Despite a new uranium ban being discussed in Congress, the U.S. is still heavily dependent on Russian uranium.

How Much Does the U.S. Depend on Russian Uranium?
This was originally posted on our Voronoi app. Download the app for free on iOS or Android and discover incredible data-driven charts from a variety of trusted sources.
The U.S. House of Representatives recently passed a ban on imports of Russian uranium. The bill must pass the Senate before becoming law.
In this graphic, we visualize how much the U.S. relies on Russian uranium, based on data from the United States Energy Information Administration (EIA).
U.S. Suppliers of Enriched Uranium
After Russia invaded Ukraine, the U.S. imposed sanctions on Russian-produced oil and gas—yet Russian-enriched uranium is still being imported.
Currently, Russia is the largest foreign supplier of nuclear power fuel to the United States. In 2022, Russia supplied almost a quarter of the enriched uranium used to fuel America’s fleet of more than 90 commercial reactors.
| Country of enrichment service | SWU* | % |
|---|---|---|
| 🇺🇸 United States | 3,876 | 27.34% |
| 🇷🇺 Russia | 3,409 | 24.04% |
| 🇩🇪 Germany | 1,763 | 12.40% |
| 🇬🇧 United Kingdom | 1,593 | 11.23% |
| 🇳🇱 Netherlands | 1,303 | 9.20% |
| Other | 2,232 | 15.79% |
| Total | 14,176 | 100% |
SWU stands for “Separative Work Unit” in the uranium industry. It is a measure of the amount of work required to separate isotopes of uranium during the enrichment process. Source: U.S. Energy Information Administration
Most of the remaining uranium is imported from European countries, while another portion is produced by a British-Dutch-German consortium operating in the United States called Urenco.
Similarly, nearly a dozen countries around the world depend on Russia for more than half of their enriched uranium—and many of them are NATO-allied members and allies of Ukraine.
In 2023 alone, the U.S. nuclear industry paid over $800 million to Russia’s state-owned nuclear energy corporation, Rosatom, and its fuel subsidiaries.
It is important to note that 19% of electricity in the U.S. is powered by nuclear plants.
The dependency on Russian fuels dates back to the 1990s when the United States turned away from its own enrichment capabilities in favor of using down-blended stocks of Soviet-era weapons-grade uranium.
As part of the new uranium-ban bill, the Biden administration plans to allocate $2.2 billion for the expansion of uranium enrichment facilities in the United States.

-

 Electrification3 years ago
Ranked: The Top 10 EV Battery Manufacturers
-

 Electrification2 years ago
The Key Minerals in an EV Battery
-

 Real Assets3 years ago
The World’s Top 10 Gold Mining Companies
-

 Misc3 years ago
All the Metals We Mined in One Visualization
-

 Electrification3 years ago
The Biggest Mining Companies in the World in 2021
-

 Energy Shift2 years ago
What Are the Five Major Types of Renewable Energy?
-

 Electrification2 years ago
Mapped: Solar Power by Country in 2021
-

 Electrification2 years ago
The World’s Largest Nickel Mining Companies