

Energy Shift
The Future of Global Coal Production (2021-2024F)
The Future of Global Coal Production Visualized
Coal is the world’s most affordable energy fuel, and as such, the world’s biggest commodity market for electricity generation.
Unfortunately, that low-cost energy comes at a high cost for the environment, with coal being the largest source of energy-related CO2 emissions.
Despite its large footprint, coal was in high demand in 2021. As economies reopened following the start of the COVID-19 pandemic, countries struggled to meet resurgent energy needs. As a readily available low-cost energy source, coal filled the supply gap, with global coal consumption increasing by 450 million tonnes or around +6% in 2021.
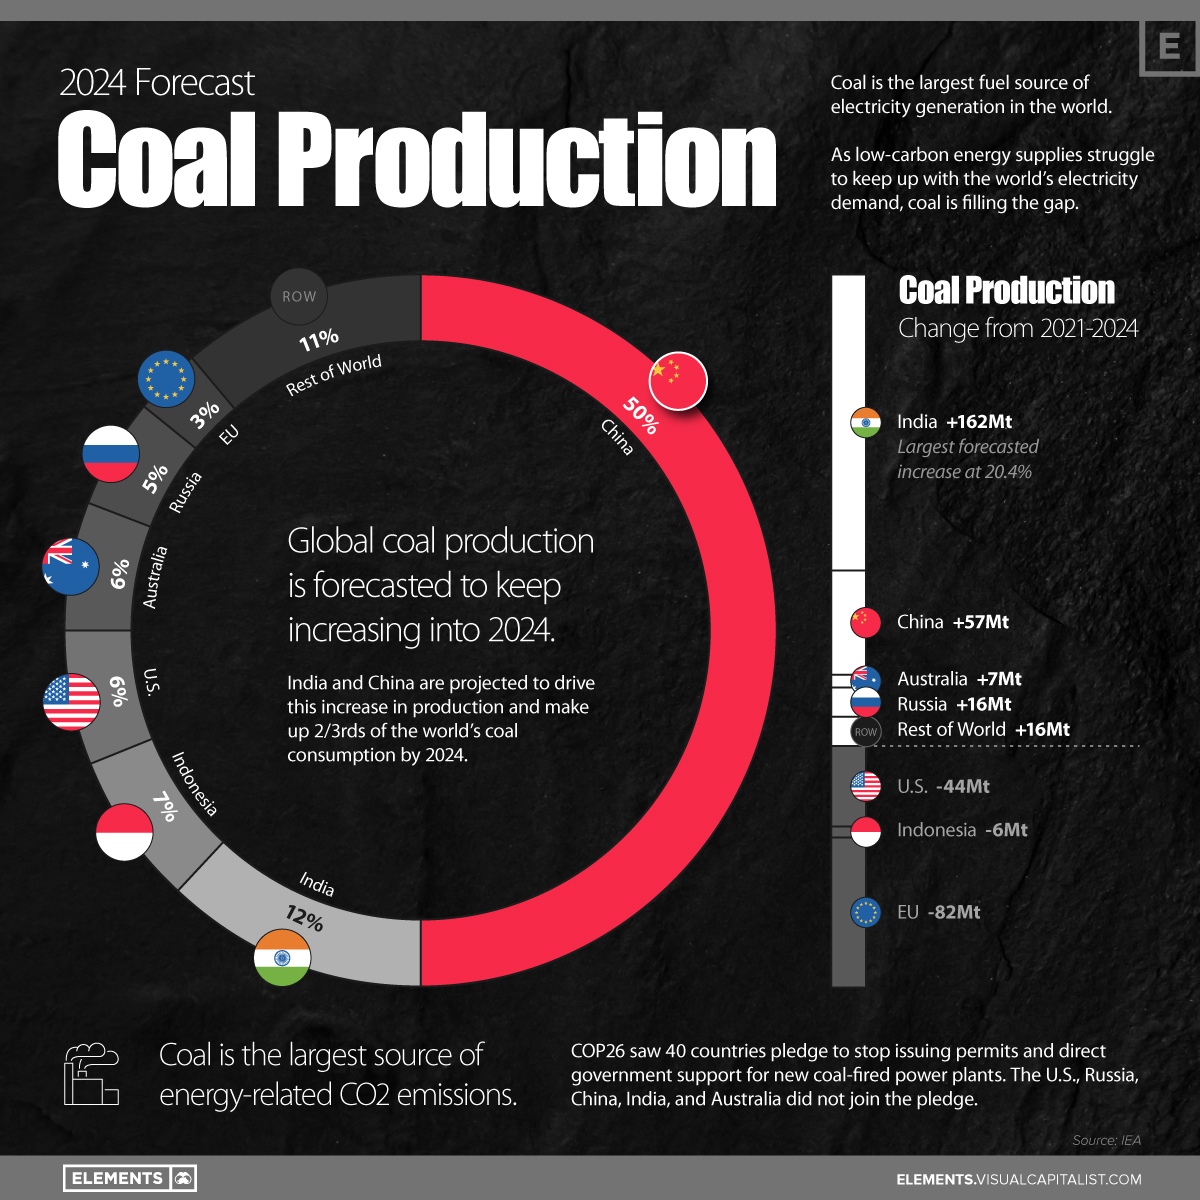
This graphic looks at the IEA’s coal production forecasts for 2024, and the specific countries projected to reduce or increase their production over the next few years.
Which Countries Are Increasing (or Reducing) Coal Production?
Global coal production was a topic of scrutiny at the COP26 conference held in November of 2021, where 40 countries pledged to stop issuing permits and direct government support for new coal-fired power plants.
However, many of the top coal-producing countries did not commit to the pledge. China, the U.S., India, Russia, and Australia abstained, and of those five, only the U.S. is forecasted to reduce coal production in the next two years.
| Country | Coal Production (2021) | Coal Production (2024F) | Share (2024F) | Change (2021–2024F) |
|---|---|---|---|---|
| 🇨🇳 China | 3,925 Mt | 3,982 Mt | 50% | +57 Mt |
| 🇮🇳 India | 793 Mt | 955 Mt | 12% | +162 Mt |
| 🇮🇩 Indonesia | 576 Mt | 570 Mt | 7% | -6 Mt |
| 🇺🇸 United States | 528 Mt | 484 Mt | 6% | -44 Mt |
| 🇦🇺 Australia | 470 Mt | 477 Mt | 6% | +7 Mt |
| 🇷🇺 Russia | 429 Mt | 445 Mt | 5% | +16 Mt |
| 🇪🇺 European Union | 329 Mt | 247 Mt | 3% | -82 Mt |
| 🌐 Other | 839 Mt | 855 Mt | 11% | +16 Mt |
Source: IEA
With 15 EU countries signing the pledge, the European Union is forecasted to see the greatest drop in coal production at 82 million tonnes, along with the greatest forecasted reduction in coal consumption (101 million tonnes, a 23% reduction).
Reducing Coal-Fired Power Generation in the U.S.
The U.S. and Indonesia are the other two major producers forecasted to reduce their reliance on coal. The U.S. is projected to cut coal production by 7.5% or 44 million tonnes, while Indonesia’s reduction is forecasted at 6 million tonnes, or just a 1% cut of its 2021 production.
Despite not joining the COP26 pledge, the U.S. is still noticeably pursuing short and long-term initiatives to reduce coal-fired power generation.
In fact, 85% of U.S. electric generating capacity retirements in 2022 are forecast to be coal-fired generators, and there are further plans to retire 28% (59 GW) of currently operational coal-fired capacity by 2035.
Coal Makes Energy Ends Meet in China and India
Modern consumption and production are instead focused in Asia.
China and India produce almost 60% of the world’s coal, and are expected to increase their production by more than 200 million tonnes per year, collectively. All this coal goes towards meeting the insatiable energy demands of both nations.
While China has pledged to start cutting down coal consumption in 2026, the country also announced the construction of 43 new coal-fired power plants to meet energy demand until then. Part of the additional production is driven by a need to reduce the country’s dependence on coal imports, which are expected to drop by 51 million tonnes or 16% from 2021–2024.
By 2024, China’s coal consumption is forecasted to rise by 3.3% and India’s by 12.2%, which would make the two countries responsible for two-thirds of the world’s coal consumption.


Energy Shift
The World’s Biggest Oil Producers in 2023
Just three countries accounted for 40% of global oil production last year.

The World’s Biggest Oil Producers in 2023
This was originally posted on our Voronoi app. Download the app for free on iOS or Android and discover incredible data-driven charts from a variety of trusted sources.
Despite efforts to decarbonize the global economy, oil still remains one of the world’s most important resources. It’s also produced by a fairly limited group of countries, which can be a source of economic and political leverage.
This graphic illustrates global crude oil production in 2023, measured in million barrels per day, sourced from the U.S. Energy Information Administration (EIA).
Three Countries Account for 40% of Global Oil Production
In 2023, the United States, Russia, and Saudi Arabia collectively contributed 32.7 million barrels per day to global oil production.
| Oil Production 2023 | Million barrels per day |
|---|---|
| 🇺🇸 U.S. | 12.9 |
| 🇷🇺 Russia | 10.1 |
| 🇸🇦 Saudi Arabia | 9.7 |
| 🇨🇦 Canada | 4.6 |
| 🇮🇶 Iraq | 4.3 |
| 🇨🇳 China | 4.2 |
| 🇮🇷 Iran | 3.6 |
| 🇧🇷 Brazil | 3.4 |
| 🇦🇪 UAE | 3.4 |
| 🇰🇼 Kuwait | 2.7 |
| 🌍 Other | 22.8 |
These three nations have consistently dominated oil production since 1971. The leading position, however, has alternated among them over the past five decades.
In contrast, the combined production of the next three largest producers—Canada, Iraq, and China—reached 13.1 million barrels per day in 2023, just surpassing the production of the United States alone.
In the near term, no country is likely to surpass the record production achieved by the U.S. in 2023, as no other producer has ever reached a daily capacity of 13.0 million barrels. Recently, Saudi Arabia’s state-owned Saudi Aramco scrapped plans to increase production capacity to 13.0 million barrels per day by 2027.
In 2024, analysts forecast that the U.S. will maintain its position as the top oil producer. In fact, according to Macquarie Group, U.S. oil production is expected to achieve a record pace of about 14 million barrels per day by the end of the year.
Energy Shift
How Much Does the U.S. Depend on Russian Uranium?
Despite a new uranium ban being discussed in Congress, the U.S. is still heavily dependent on Russian uranium.

How Much Does the U.S. Depend on Russian Uranium?
This was originally posted on our Voronoi app. Download the app for free on iOS or Android and discover incredible data-driven charts from a variety of trusted sources.
The U.S. House of Representatives recently passed a ban on imports of Russian uranium. The bill must pass the Senate before becoming law.
In this graphic, we visualize how much the U.S. relies on Russian uranium, based on data from the United States Energy Information Administration (EIA).
U.S. Suppliers of Enriched Uranium
After Russia invaded Ukraine, the U.S. imposed sanctions on Russian-produced oil and gas—yet Russian-enriched uranium is still being imported.
Currently, Russia is the largest foreign supplier of nuclear power fuel to the United States. In 2022, Russia supplied almost a quarter of the enriched uranium used to fuel America’s fleet of more than 90 commercial reactors.
| Country of enrichment service | SWU* | % |
|---|---|---|
| 🇺🇸 United States | 3,876 | 27.34% |
| 🇷🇺 Russia | 3,409 | 24.04% |
| 🇩🇪 Germany | 1,763 | 12.40% |
| 🇬🇧 United Kingdom | 1,593 | 11.23% |
| 🇳🇱 Netherlands | 1,303 | 9.20% |
| Other | 2,232 | 15.79% |
| Total | 14,176 | 100% |
SWU stands for “Separative Work Unit” in the uranium industry. It is a measure of the amount of work required to separate isotopes of uranium during the enrichment process. Source: U.S. Energy Information Administration
Most of the remaining uranium is imported from European countries, while another portion is produced by a British-Dutch-German consortium operating in the United States called Urenco.
Similarly, nearly a dozen countries around the world depend on Russia for more than half of their enriched uranium—and many of them are NATO-allied members and allies of Ukraine.
In 2023 alone, the U.S. nuclear industry paid over $800 million to Russia’s state-owned nuclear energy corporation, Rosatom, and its fuel subsidiaries.
It is important to note that 19% of electricity in the U.S. is powered by nuclear plants.
The dependency on Russian fuels dates back to the 1990s when the United States turned away from its own enrichment capabilities in favor of using down-blended stocks of Soviet-era weapons-grade uranium.
As part of the new uranium-ban bill, the Biden administration plans to allocate $2.2 billion for the expansion of uranium enrichment facilities in the United States.

-

 Electrification3 years ago
Ranked: The Top 10 EV Battery Manufacturers
-

 Electrification2 years ago
The Key Minerals in an EV Battery
-

 Real Assets3 years ago
The World’s Top 10 Gold Mining Companies
-

 Misc3 years ago
All the Metals We Mined in One Visualization
-

 Electrification3 years ago
The Biggest Mining Companies in the World in 2021
-

 Energy Shift2 years ago
What Are the Five Major Types of Renewable Energy?
-

 Electrification2 years ago
Mapped: Solar Power by Country in 2021
-

 Electrification2 years ago
The World’s Largest Nickel Mining Companies