

Energy Shift
How Energy Prices Performed in 2021
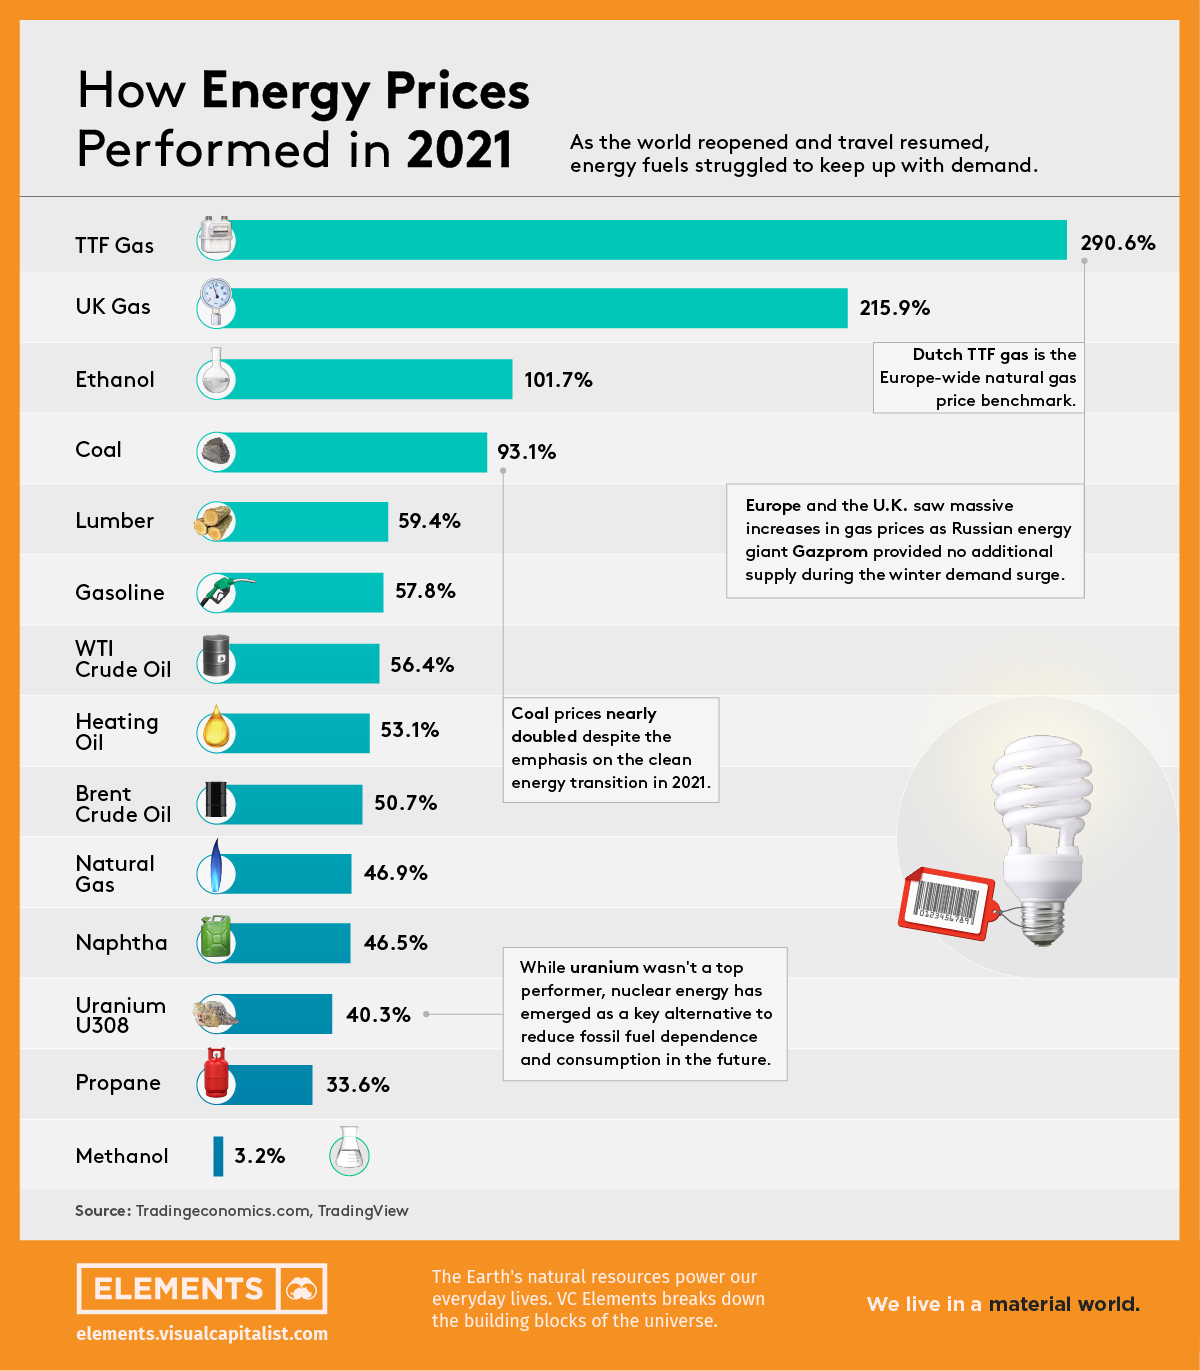
How Energy Prices Performed in 2021
A year after the start of the COVID-19 pandemic, the world started to reopen and generate insatiable energy demand. Supply shortages and the clean energy transition further fueled the rise of all energy commodities.
Even in a year where markets and commodities performed strongly, energy prices stood out. The energy component of the Goldman Sachs Commodity Index (GSCI) rose by 59% in 2021, returning more than double any other component in the index.
Let’s take a look at how energy commodities performed in 2021, as tracked by Trading Economics and TradingView.
How Much Did Energy Prices Climb in 2021?
After dipping into negative prices in April of 2020, WTI crude oil had a strong bounce back.
Many of crude oil’s derivative products also increased in price by double digits, resulting in higher gas prices at the pump. The U.S. average retail price for gasoline increased by 45.8% to close at $3.28/gal, while wholesale prices of RBOB gasoline also climbed by 57.8%.
| Asset | 2021 Returns |
|---|---|
| TTF Gas | 290.6% |
| UK Gas | 215.9% |
| Ethanol | 101.7% |
| Coal | 93.1% |
| Lumber | 59.4% |
| RBOB Gasoline | 57.8% |
| WTI Crude Oil | 56.4% |
| Heating Oil | 53.1% |
| Brent Crude Oil | 50.7% |
| Natural Gas | 46.9% |
| Naphtha | 46.5% |
| Uranium U308 | 40.3% |
| Propane | 33.6% |
| Methanol | 3.2% |
Natural gas prices in Europe and the UK saw the biggest price increases in 2021, jumping more than 200%.
They were followed by ethanol, a biofuel that oil refiners are required to blend with their products. This requirement, along with the price rises in corn and sugar (ethanol’s primary raw materials around the world), made this hot commodity even more expensive.
Rising Natural Gas Prices Fuel Tension and Unrest
While the U.S. saw increases in its gasoline prices as well, these were mild compared to surges in Europe and elsewhere.
With close to 43% of Europe’s total gas imports coming from Russia, no additional supply was provided during the cold winter months. This was compounded as Germany’s approval of the Nord Stream 2 pipeline has remained in limbo.
So far, 2022 has been a continuation of these trends. For example, liquified petroleum gas (LPG) prices have nearly doubled due to unrest in Kazakhstan. The Kazakhstan government’s decision to lift price controls on LPG (the primary fuel for Kazakh cars) saw prices surge and led to days of protests and Russian intervention.
Coal Stays Strong Despite the Clean Energy Transition
Despite 2021’s emphasis on the clean energy transition, coal prices nearly doubled as the world was unable to shake off its dependence on the fossil fuel.
Even pledges from the COP26 climate change conference, such as China’s to reduce coal consumption after 2025, are not yet having an impact on prices. That’s because the country is still planning to add up to 150 gigawatts of new coal-fired capacity before then.
On the other hand, uranium couldn’t keep up with the price rises of fossil fuels. Although the energy metal had a breakout year as one of the recently renewed hopes for cleaner energy, the outlook for nuclear energy adoption and development is still mixed.
While China is expected to invest as much as $440B into new nuclear power plants over the next 10 years, Germany shut down half of its remaining plants in 2021.
After the surge of energy prices in 2021, nations will need to carefully manage their clean energy transitions to avoid further unsustainable price rises.


Energy Shift
The World’s Biggest Oil Producers in 2023
Just three countries accounted for 40% of global oil production last year.

The World’s Biggest Oil Producers in 2023
This was originally posted on our Voronoi app. Download the app for free on iOS or Android and discover incredible data-driven charts from a variety of trusted sources.
Despite efforts to decarbonize the global economy, oil still remains one of the world’s most important resources. It’s also produced by a fairly limited group of countries, which can be a source of economic and political leverage.
This graphic illustrates global crude oil production in 2023, measured in million barrels per day, sourced from the U.S. Energy Information Administration (EIA).
Three Countries Account for 40% of Global Oil Production
In 2023, the United States, Russia, and Saudi Arabia collectively contributed 32.7 million barrels per day to global oil production.
| Oil Production 2023 | Million barrels per day |
|---|---|
| 🇺🇸 U.S. | 12.9 |
| 🇷🇺 Russia | 10.1 |
| 🇸🇦 Saudi Arabia | 9.7 |
| 🇨🇦 Canada | 4.6 |
| 🇮🇶 Iraq | 4.3 |
| 🇨🇳 China | 4.2 |
| 🇮🇷 Iran | 3.6 |
| 🇧🇷 Brazil | 3.4 |
| 🇦🇪 UAE | 3.4 |
| 🇰🇼 Kuwait | 2.7 |
| 🌍 Other | 22.8 |
These three nations have consistently dominated oil production since 1971. The leading position, however, has alternated among them over the past five decades.
In contrast, the combined production of the next three largest producers—Canada, Iraq, and China—reached 13.1 million barrels per day in 2023, just surpassing the production of the United States alone.
In the near term, no country is likely to surpass the record production achieved by the U.S. in 2023, as no other producer has ever reached a daily capacity of 13.0 million barrels. Recently, Saudi Arabia’s state-owned Saudi Aramco scrapped plans to increase production capacity to 13.0 million barrels per day by 2027.
In 2024, analysts forecast that the U.S. will maintain its position as the top oil producer. In fact, according to Macquarie Group, U.S. oil production is expected to achieve a record pace of about 14 million barrels per day by the end of the year.
Energy Shift
How Much Does the U.S. Depend on Russian Uranium?
Despite a new uranium ban being discussed in Congress, the U.S. is still heavily dependent on Russian uranium.

How Much Does the U.S. Depend on Russian Uranium?
This was originally posted on our Voronoi app. Download the app for free on iOS or Android and discover incredible data-driven charts from a variety of trusted sources.
The U.S. House of Representatives recently passed a ban on imports of Russian uranium. The bill must pass the Senate before becoming law.
In this graphic, we visualize how much the U.S. relies on Russian uranium, based on data from the United States Energy Information Administration (EIA).
U.S. Suppliers of Enriched Uranium
After Russia invaded Ukraine, the U.S. imposed sanctions on Russian-produced oil and gas—yet Russian-enriched uranium is still being imported.
Currently, Russia is the largest foreign supplier of nuclear power fuel to the United States. In 2022, Russia supplied almost a quarter of the enriched uranium used to fuel America’s fleet of more than 90 commercial reactors.
| Country of enrichment service | SWU* | % |
|---|---|---|
| 🇺🇸 United States | 3,876 | 27.34% |
| 🇷🇺 Russia | 3,409 | 24.04% |
| 🇩🇪 Germany | 1,763 | 12.40% |
| 🇬🇧 United Kingdom | 1,593 | 11.23% |
| 🇳🇱 Netherlands | 1,303 | 9.20% |
| Other | 2,232 | 15.79% |
| Total | 14,176 | 100% |
SWU stands for “Separative Work Unit” in the uranium industry. It is a measure of the amount of work required to separate isotopes of uranium during the enrichment process. Source: U.S. Energy Information Administration
Most of the remaining uranium is imported from European countries, while another portion is produced by a British-Dutch-German consortium operating in the United States called Urenco.
Similarly, nearly a dozen countries around the world depend on Russia for more than half of their enriched uranium—and many of them are NATO-allied members and allies of Ukraine.
In 2023 alone, the U.S. nuclear industry paid over $800 million to Russia’s state-owned nuclear energy corporation, Rosatom, and its fuel subsidiaries.
It is important to note that 19% of electricity in the U.S. is powered by nuclear plants.
The dependency on Russian fuels dates back to the 1990s when the United States turned away from its own enrichment capabilities in favor of using down-blended stocks of Soviet-era weapons-grade uranium.
As part of the new uranium-ban bill, the Biden administration plans to allocate $2.2 billion for the expansion of uranium enrichment facilities in the United States.

-

 Electrification3 years ago
Ranked: The Top 10 EV Battery Manufacturers
-

 Electrification2 years ago
The Key Minerals in an EV Battery
-

 Real Assets3 years ago
The World’s Top 10 Gold Mining Companies
-

 Misc3 years ago
All the Metals We Mined in One Visualization
-

 Electrification3 years ago
The Biggest Mining Companies in the World in 2021
-

 Energy Shift2 years ago
What Are the Five Major Types of Renewable Energy?
-

 Electrification2 years ago
Mapped: Solar Power by Country in 2021
-

 Electrification2 years ago
The World’s Largest Nickel Mining Companies