

Energy Shift
The Largest Oil and Gas Companies in the World
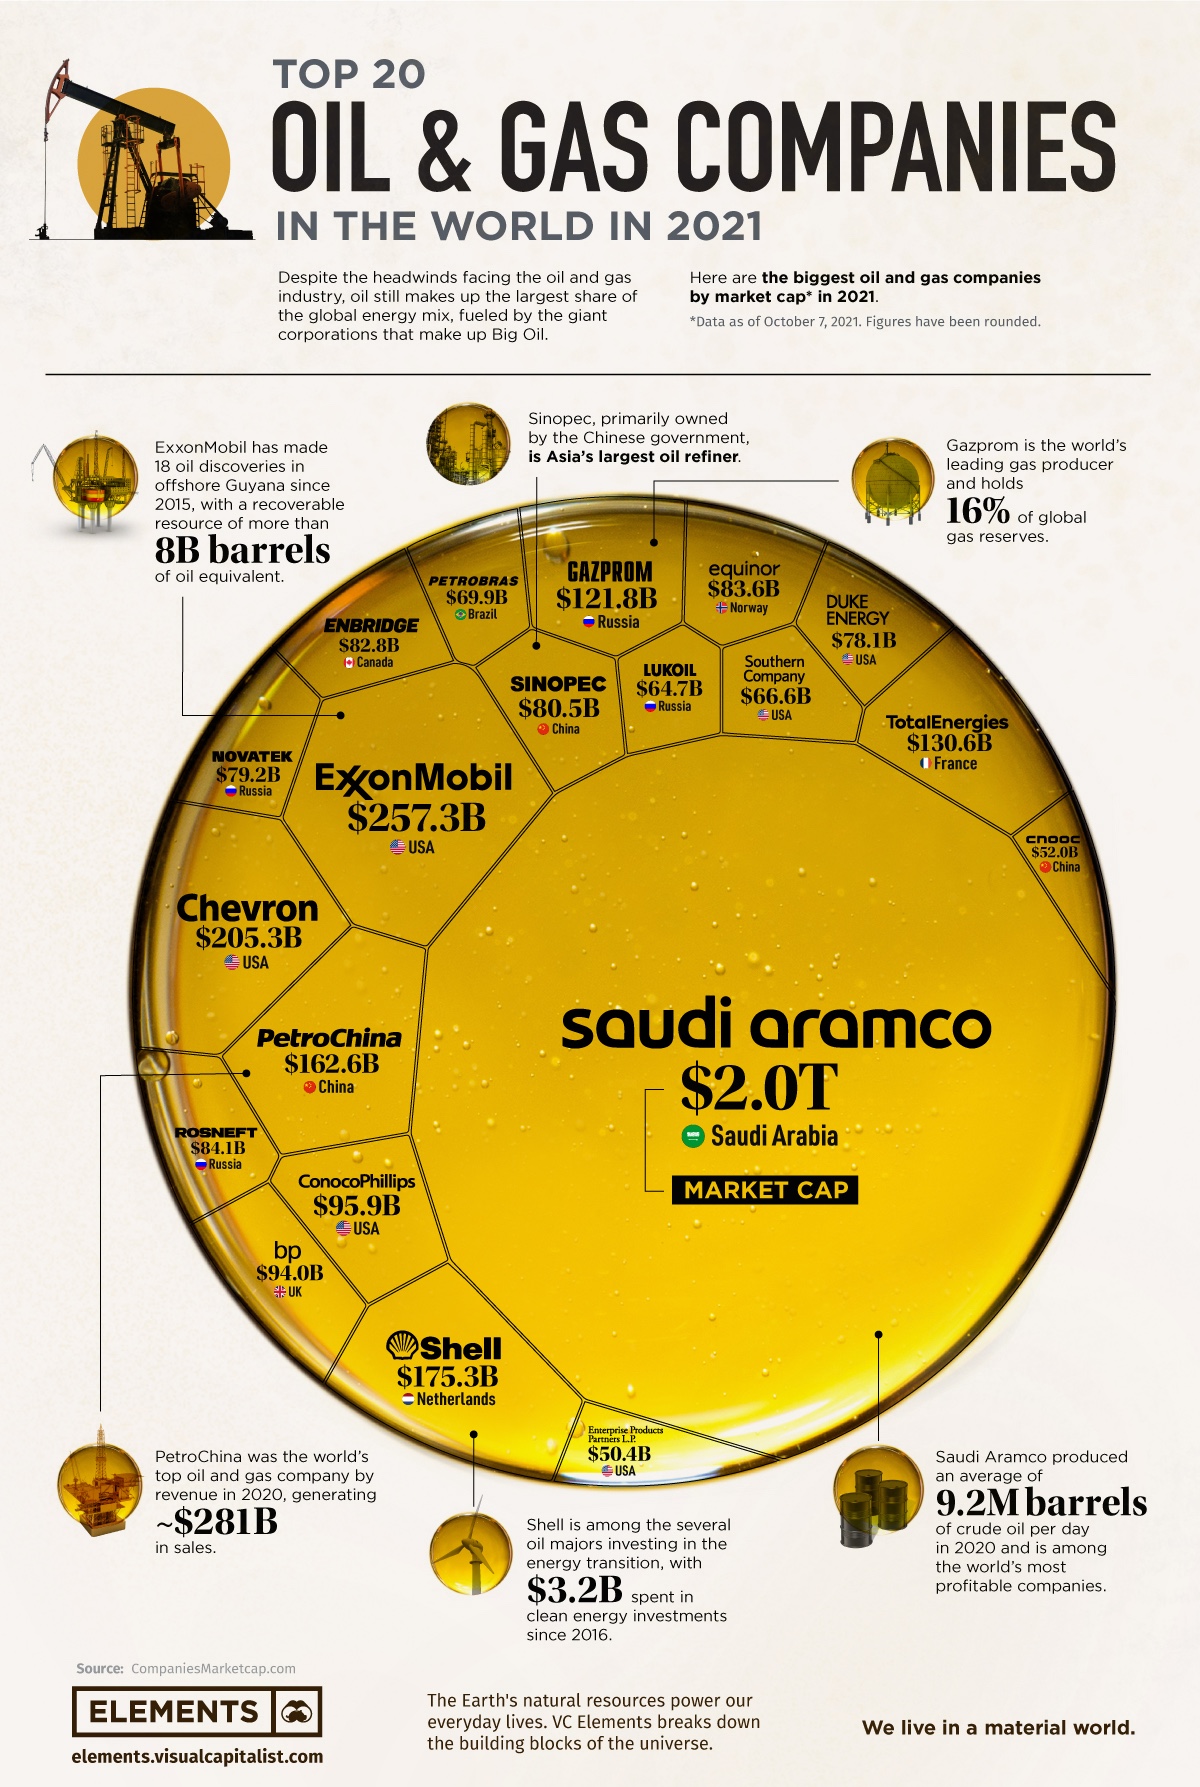
The Largest Oil & Gas Companies in 2021
The pandemic brought strong headwinds for the oil and gas industry, and oil majors felt the blow.
Global primary energy consumption fell by 4.5% relative to 2019 and oil demand declined by 9%. For a brief period in April 2020, the price of West Texas Intermediate (WTI) crude futures went subzero, marking the largest one-day price plunge since 1983.
Some expected the demand crash to have a lasting impact on the industry, but it’s safe to say that 2021 has proved otherwise.
Oil Resurfaces as Energy Crisis Deepens
The world is facing a shortage of energy, and peak winter is yet to hit most parts of the globe.
Pandemic-induced supply restraints from producers, in addition to rising energy demand from recovering economies, have sent nations scrambling for petroleum products. Consequently, oil prices are resurfacing to pre-pandemic levels.
As of today, prices of WTI crude futures are at their highest levels in the last five years at over $80 per barrel. Furthermore, U.S. natural gas prices hit a 7-year high of $6.5 per million British thermal units (BTU) earlier this month. Elsewhere, European benchmark natural gas futures have surged 1,300% since May 2020.
Of course, the largest oil and gas companies are riding this wave of resurgence. Using data from CompaniesMarketCap.com, the above infographic ranks the top 20 oil and gas companies by market cap as of October 7, 2021.
Big Oil: The Largest Oil and Gas Companies by Market Cap
Given that we often see their logos at gas stations, the largest oil and gas companies are generally quite well-known. Here’s how they stack up by market cap:
| Rank | Company | Market Cap* (US$, billions) | Country |
|---|---|---|---|
| 1 | Saudi Aramco | $1,979 | Saudi Arabia 🇸🇦 |
| 2 | ExxonMobil | $257.30 | U.S. 🇺🇸 |
| 3 | Chevron | $205.29 | U.S. 🇺🇸 |
| 4 | Shell | $175.28 | Netherlands 🇳🇱 |
| 5 | PetroChina | $162.55 | China 🇨🇳 |
| 6 | TotalEnergies | $130.56 | France 🇫🇷 |
| 7 | Gazprom | $121.77 | Russia 🇷🇺 |
| 8 | ConocoPhillips | $95.93 | U.S. 🇺🇸 |
| 9 | BP | $93.97 | U.K. 🇬🇧 |
| 10 | Rosneft | $84.07 | Russia 🇷🇺 |
| 11 | Equinor | $83.60 | Norway 🇳🇴 |
| 12 | Enbridge | $82.82 | Canada 🇨🇦 |
| 13 | Sinopec | $80.48 | China 🇨🇳 |
| 14 | Novatek | $79.18 | Russia 🇷🇺 |
| 15 | Duke Energy | $78.08 | U.S. 🇺🇸 |
| 16 | Petrobras | $69.91 | Brazil 🇧🇷 |
| 17 | Southern Company | $66.64 | U.S. 🇺🇸 |
| 18 | Lukoil | $64.70 | Russia 🇷🇺 |
| 19 | CNOOC | $52.04 | China 🇨🇳 |
| 20 | Enterprise Products | $50.37 | U.S. 🇺🇸 |
*As of October 7, 2021.
Saudi Aramco is one of the five companies in the trillion-dollar club as the world’s third-largest company by market cap. Its market cap is nearly equivalent to the combined valuation of the other 19 companies on the list. But what makes this figure even more astounding is the fact that the company went public less than two years ago in December 2019.
However, the oil giant’s valuation doesn’t come out of the blue. Aramco was the world’s most profitable company in 2019, raking in $88 billion in net income. Apple took this title in 2020, but high oil prices could propel Aramco back to the top in 2021.
Although Standard Oil was split up a century ago, its legacy lives on today in the form of Big Oil. ExxonMobil and Chevron—the second and third-largest companies on the list—are direct descendants of Standard Oil. Furthermore, Shell and BP both acquired assets from Standard Oil’s original portfolio on the road to becoming global oil giants.
The geographical distribution of the largest oil and gas companies shows how global the industry is. The top 20 oil and gas companies come from 10 different countries. The U.S. hosts six of them, while four are headquartered in Russia. The other 10 are located in one of China, Brazil, Saudi Arabia, or Europe.
Big Oil, Bigger Emissions
Due to the nature of fossil fuels, the biggest oil and gas companies are also among the biggest greenhouse gas (GHG) emitters.
In fact, Saudi Aramco is the world’s largest corporate GHG emitter and accounts for over 4% of the entire world’s emissions since 1965. Chevron, Gazprom, ExxonMobil, BP, and several other oil giants join Aramco on the list of top 20 GHG emitters between 1965 and 2017.
Shifting towards a low-carbon future will undoubtedly require the world to rely less on fossil fuels. But completely shunning the oil and gas industry isn’t possible at the moment, as shown by the global energy crisis.


Energy Shift
The World’s Biggest Oil Producers in 2023
Just three countries accounted for 40% of global oil production last year.

The World’s Biggest Oil Producers in 2023
This was originally posted on our Voronoi app. Download the app for free on iOS or Android and discover incredible data-driven charts from a variety of trusted sources.
Despite efforts to decarbonize the global economy, oil still remains one of the world’s most important resources. It’s also produced by a fairly limited group of countries, which can be a source of economic and political leverage.
This graphic illustrates global crude oil production in 2023, measured in million barrels per day, sourced from the U.S. Energy Information Administration (EIA).
Three Countries Account for 40% of Global Oil Production
In 2023, the United States, Russia, and Saudi Arabia collectively contributed 32.7 million barrels per day to global oil production.
| Oil Production 2023 | Million barrels per day |
|---|---|
| 🇺🇸 U.S. | 12.9 |
| 🇷🇺 Russia | 10.1 |
| 🇸🇦 Saudi Arabia | 9.7 |
| 🇨🇦 Canada | 4.6 |
| 🇮🇶 Iraq | 4.3 |
| 🇨🇳 China | 4.2 |
| 🇮🇷 Iran | 3.6 |
| 🇧🇷 Brazil | 3.4 |
| 🇦🇪 UAE | 3.4 |
| 🇰🇼 Kuwait | 2.7 |
| 🌍 Other | 22.8 |
These three nations have consistently dominated oil production since 1971. The leading position, however, has alternated among them over the past five decades.
In contrast, the combined production of the next three largest producers—Canada, Iraq, and China—reached 13.1 million barrels per day in 2023, just surpassing the production of the United States alone.
In the near term, no country is likely to surpass the record production achieved by the U.S. in 2023, as no other producer has ever reached a daily capacity of 13.0 million barrels. Recently, Saudi Arabia’s state-owned Saudi Aramco scrapped plans to increase production capacity to 13.0 million barrels per day by 2027.
In 2024, analysts forecast that the U.S. will maintain its position as the top oil producer. In fact, according to Macquarie Group, U.S. oil production is expected to achieve a record pace of about 14 million barrels per day by the end of the year.
Energy Shift
How Much Does the U.S. Depend on Russian Uranium?
Despite a new uranium ban being discussed in Congress, the U.S. is still heavily dependent on Russian uranium.

How Much Does the U.S. Depend on Russian Uranium?
This was originally posted on our Voronoi app. Download the app for free on iOS or Android and discover incredible data-driven charts from a variety of trusted sources.
The U.S. House of Representatives recently passed a ban on imports of Russian uranium. The bill must pass the Senate before becoming law.
In this graphic, we visualize how much the U.S. relies on Russian uranium, based on data from the United States Energy Information Administration (EIA).
U.S. Suppliers of Enriched Uranium
After Russia invaded Ukraine, the U.S. imposed sanctions on Russian-produced oil and gas—yet Russian-enriched uranium is still being imported.
Currently, Russia is the largest foreign supplier of nuclear power fuel to the United States. In 2022, Russia supplied almost a quarter of the enriched uranium used to fuel America’s fleet of more than 90 commercial reactors.
| Country of enrichment service | SWU* | % |
|---|---|---|
| 🇺🇸 United States | 3,876 | 27.34% |
| 🇷🇺 Russia | 3,409 | 24.04% |
| 🇩🇪 Germany | 1,763 | 12.40% |
| 🇬🇧 United Kingdom | 1,593 | 11.23% |
| 🇳🇱 Netherlands | 1,303 | 9.20% |
| Other | 2,232 | 15.79% |
| Total | 14,176 | 100% |
SWU stands for “Separative Work Unit” in the uranium industry. It is a measure of the amount of work required to separate isotopes of uranium during the enrichment process. Source: U.S. Energy Information Administration
Most of the remaining uranium is imported from European countries, while another portion is produced by a British-Dutch-German consortium operating in the United States called Urenco.
Similarly, nearly a dozen countries around the world depend on Russia for more than half of their enriched uranium—and many of them are NATO-allied members and allies of Ukraine.
In 2023 alone, the U.S. nuclear industry paid over $800 million to Russia’s state-owned nuclear energy corporation, Rosatom, and its fuel subsidiaries.
It is important to note that 19% of electricity in the U.S. is powered by nuclear plants.
The dependency on Russian fuels dates back to the 1990s when the United States turned away from its own enrichment capabilities in favor of using down-blended stocks of Soviet-era weapons-grade uranium.
As part of the new uranium-ban bill, the Biden administration plans to allocate $2.2 billion for the expansion of uranium enrichment facilities in the United States.

-

 Electrification3 years ago
Ranked: The Top 10 EV Battery Manufacturers
-

 Electrification2 years ago
The Key Minerals in an EV Battery
-

 Real Assets3 years ago
The World’s Top 10 Gold Mining Companies
-

 Misc3 years ago
All the Metals We Mined in One Visualization
-

 Electrification3 years ago
The Biggest Mining Companies in the World in 2021
-

 Energy Shift2 years ago
What Are the Five Major Types of Renewable Energy?
-

 Electrification2 years ago
Mapped: Solar Power by Country in 2021
-

 Electrification2 years ago
The World’s Largest Nickel Mining Companies