

Electrification
Electric Car Companies: Visualizing the Race for EV Dominance
Electric Car Companies: Eating Tesla’s Dust
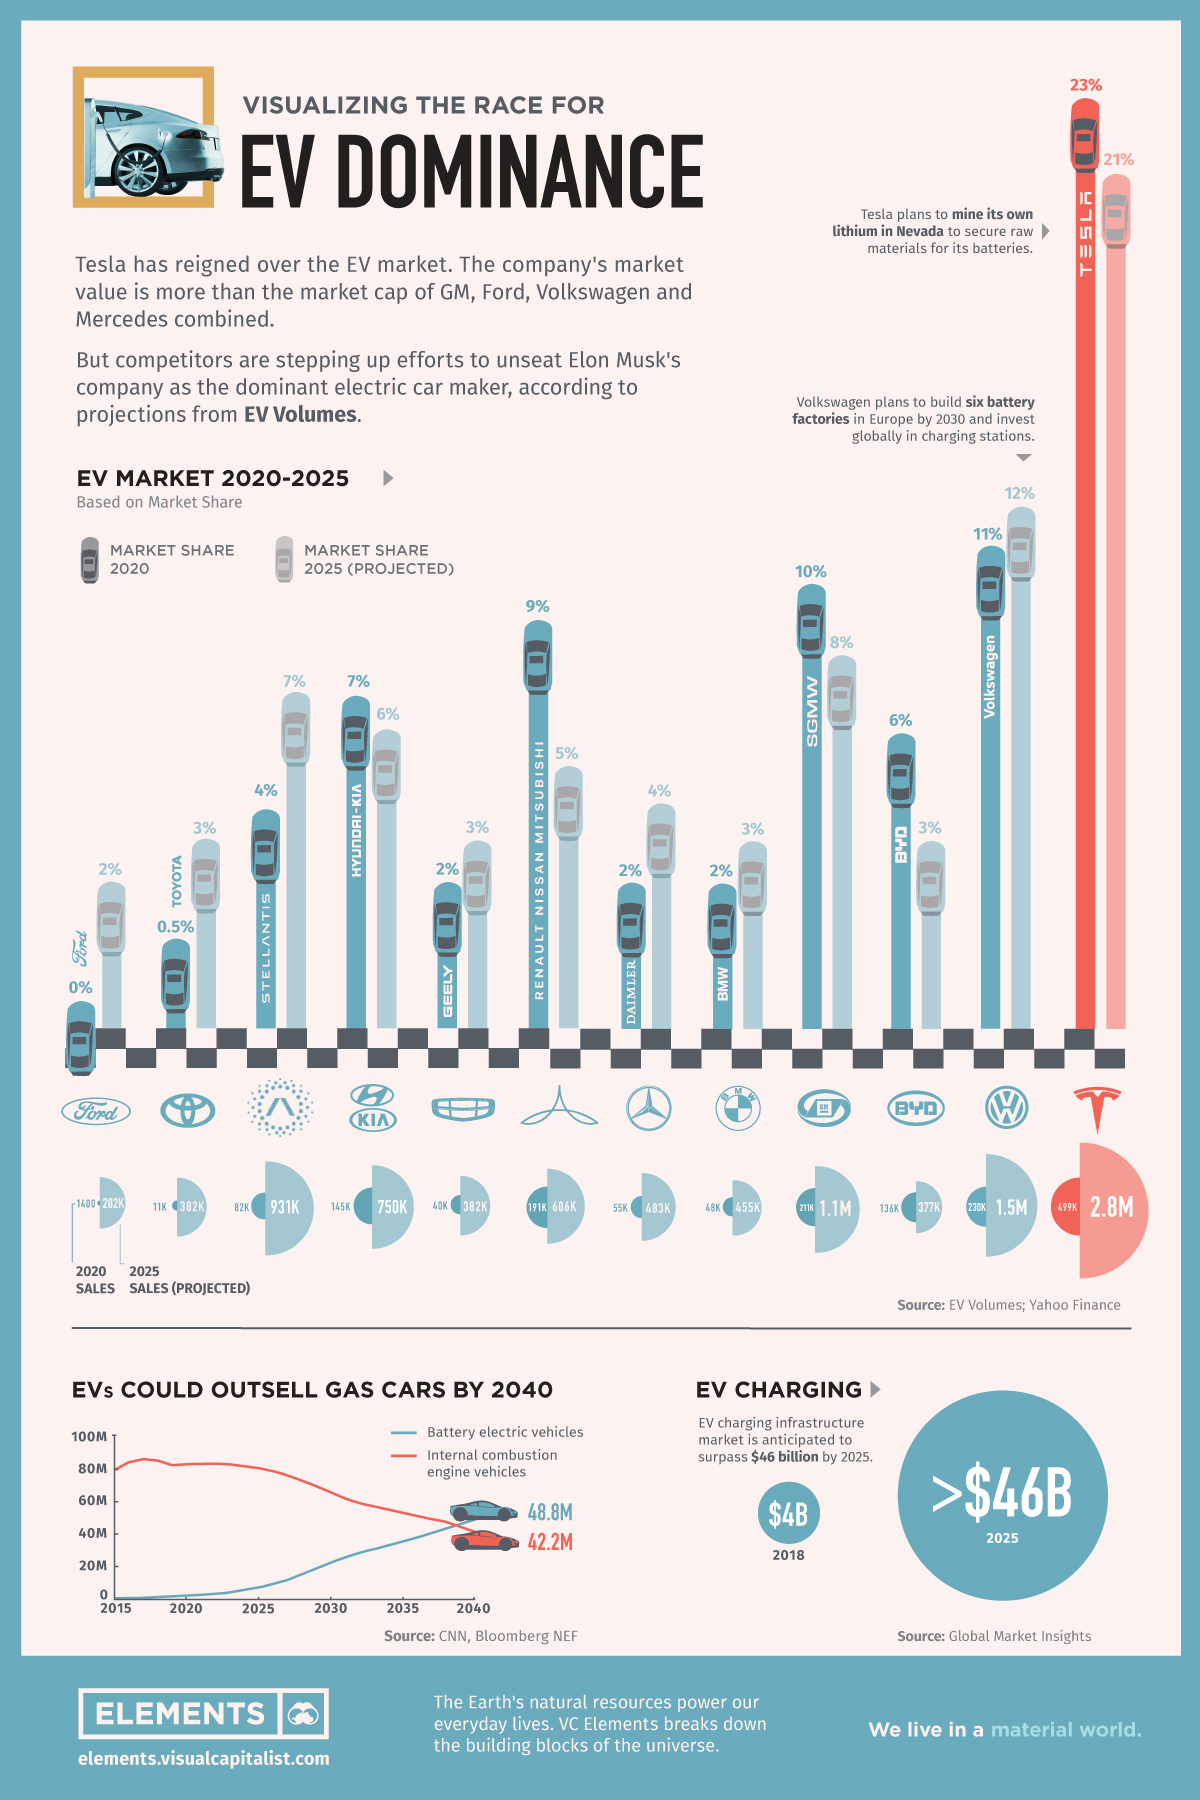
Tesla has reigned supreme among electric car companies, ever since it first released the Roadster back in 2008.
The California-based company headed by Elon Musk ended 2020 with 23% of the EV market and recently became the first automaker to hit a $1 trillion market capitalization. However, competitors like Volkswagen hope to accelerate their own EV efforts to unseat Musk’s company as the dominant manufacturer.
This graphic based on data from EV Volumes compares Tesla and other top carmakers’ positions today—from an all-electric perspective—and gives market share projections for 2025.
Auto Majors Playing Catch-up
According to Wood Mackenzie, Volkswagen will become the largest manufacturer of EVs before 2030. In order to achieve this, the world’s second-biggest carmaker is in talks with suppliers to secure direct access to the raw materials for batteries.
It also plans to build six battery factories in Europe by 2030 and to invest globally in charging stations. Still, according to EV Volumes projections, by 2025 the German company is forecasted to have only 12% of the market versus Tesla’s 21%.
| Company | Sales 2020 | Sales 2025 (projections) | Market cap (Oct '21, USD) |
|---|---|---|---|
| Tesla | 499,000 | 2.8M | $1.023T |
| Volkswagen Group | 230,000 | 1.5M | $170B |
| BYD | 136,000 | 377,000 | $113B |
| SGMW (GM, Wulling Motors, SAIC) | 211,000 | 1.1M | $89B |
| BMW | 48,000 | 455,000 | $67B |
| Daimler (Mercedes-Benz) | 55,000 | 483,000 | $103B |
| Renault-Nissan-Mitsubishi | 191,000 | 606,000 | $39B |
| Geely | 40,000 | 382,000 | $34B |
| Hyundai -Kia | 145,000 | 750,000 | $112B |
| Stellantis | 82,000 | 931,000 | $63B |
| Toyota | 11,000 | 382,000 | $240B |
| Ford | 1,400 | 282,000 | $63B |
Other auto giants are following the same track towards EV adoption.
GM, the largest U.S. automaker, wants to stop selling fuel-burning cars by 2035. The company is making a big push into pure electric vehicles, with more than 30 new models expected by 2025.
Meanwhile, Ford expects 40% of its vehicles sold to be electric by the year 2030. The American carmaker has laid out plans to invest tens of billions of dollars in electric and autonomous vehicle efforts in the coming years.
Tesla’s Brand: A Secret Weapon
When it comes to electric car company brand awareness in the marketplace, Tesla still surpasses all others. In fact, more than one-fourth of shoppers who are considering an EV said Tesla is their top choice.
“They’ve done a wonderful job at presenting themselves as the innovative leader of electric vehicles and therefore, this is translating high awareness among consumers…”
—Rachelle Petusky, Research at Cox Automotive Mobility Group
Tesla recently surpassed Audi as the fourth-largest luxury car brand in the United States in 2020. It is now just behind BMW, Lexus, and Mercedes-Benz.
The Dominance of Electric Car Companies by 2040
BloombergNEF expects annual passenger EV sales to reach 13 million in 2025, 28 million in 2030, and 48 million by 2040, outselling gasoline and diesel models (42 million).
As the EV market continues to grow globally, competitors hope to take a run at Tesla’s lead—or at least stay in the race.


Electrification
Ranked: The Top 10 EV Battery Manufacturers in 2023
Asia dominates this ranking of the world’s largest EV battery manufacturers in 2023.

The Top 10 EV Battery Manufacturers in 2023
This was originally posted on our Voronoi app. Download the app for free on iOS or Android and discover incredible data-driven charts from a variety of trusted sources.
Despite efforts from the U.S. and EU to secure local domestic supply, all major EV battery manufacturers remain based in Asia.
In this graphic we rank the top 10 EV battery manufacturers by total battery deployment (measured in megawatt-hours) in 2023. The data is from EV Volumes.
Chinese Dominance
Contemporary Amperex Technology Co. Limited (CATL) has swiftly risen in less than a decade to claim the title of the largest global battery group.
The Chinese company now has a 34% share of the market and supplies batteries to a range of made-in-China vehicles, including the Tesla Model Y, SAIC’s MG4/Mulan, and Li Auto models.
| Company | Country | 2023 Production (megawatt-hour) | Share of Total Production |
|---|---|---|---|
| CATL | 🇨🇳China | 242,700 | 34% |
| BYD | 🇨🇳China | 115,917 | 16% |
| LG Energy Solution | 🇰🇷Korea | 108,487 | 15% |
| Panasonic | 🇯🇵Japan | 56,560 | 8% |
| SK On | 🇰🇷Korea | 40,711 | 6% |
| Samsung SDI | 🇰🇷Korea | 35,703 | 5% |
| CALB | 🇨🇳China | 23,493 | 3% |
| Farasis Energy | 🇨🇳China | 16,527 | 2% |
| Envision AESC | 🇨🇳China | 8,342 | 1% |
| Sunwoda | 🇨🇳China | 6,979 | 1% |
| Other | - | 56,040 | 8% |
In 2023, BYD surpassed LG Energy Solution to claim second place. This was driven by demand from its own models and growth in third-party deals, including providing batteries for the made-in-Germany Tesla Model Y, Toyota bZ3, Changan UNI-V, Venucia V-Online, as well as several Haval and FAW models.
The top three battery makers (CATL, BYD, LG) collectively account for two-thirds (66%) of total battery deployment.
Once a leader in the EV battery business, Panasonic now holds the fourth position with an 8% market share, down from 9% last year. With its main client, Tesla, now effectively sourcing batteries from multiple suppliers, the Japanese battery maker seems to be losing its competitive edge in the industry.
Overall, the global EV battery market size is projected to grow from $49 billion in 2022 to $98 billion by 2029, according to Fortune Business Insights.
Electrification
White Gold: Mapping U.S. Lithium Mines
In this graphic, Visual Capitalist partnerered with EnergyX to explore the size and location of U.S. lithium mines.

White Gold: Mapping U.S. Lithium Mines
The U.S. doubled imports of lithium-ion batteries for the third consecutive year in 2022, and with EV demand growing yearly, U.S. lithium mines must ramp up production or rely on other nations for their supply of refined lithium.
To determine if the domestic U.S. lithium opportunity can meet demand, we partnered with EnergyX to determine how much lithium sits within U.S. borders.
U.S. Lithium Projects
The most crucial measure of a lithium mine’s potential is the quantity that can be extracted from the source.
For each lithium resource, the potential volume of lithium carbonate equivalent (LCE) was calculated with a ratio of one metric ton of lithium producing 5.32 metric tons of LCE. Cumulatively, existing U.S. lithium projects contain 94.8 million metric tons of LCE.
| Rank | Project Name | LCE, million metric tons (est.) |
|---|---|---|
| 1 | McDermitt Caldera | 21.5 |
| 2 | Thacker Pass | 19.1 |
| 3 | Tonopah Flats | 18.0 |
| 4 | TLC Lithium | 10.7 |
| 5 | Clayton Valley (Century Lithium) | 6.3 |
| 6 | Zeus Lithium | 6.3 |
| 7 | Rhyolite Ridge | 3.4 |
| 8 | Arkansas Smackover (Phase 1A) | 2.8 |
| 9 | Basin Project | 2.2 |
| 10 | McGee Deposit | 2.1 |
| 11 | Arkansas Smackover (South West) | 1.8 |
| 12 | Clayton Valley (Lithium-X, Pure Energy) | 0.8 |
| 13 | Big Sandy | 0.3 |
| 14 | Imperial Valley/Salton Sea | 0.3 |
U.S. Lithium Opportunities, By State
U.S. lithium projects mainly exist in western states, with comparatively minor opportunities in central or eastern states.
| State | LCE, million metric tons (est.) |
|---|---|
| Nevada | 88.2 |
| Arkansas | 4.6 |
| Arizona | 2.5 |
| California | 0.3 |
Currently, the U.S. is sitting on a wealth of lithium that it is underutilizing. For context, in 2022, the U.S. only produced about 5,000 metric tons of LCE and imported a projected 19,000 metric tons of LCE, showing that the demand for the mineral is healthy.
The Next Gold Rush?
U.S. lithium companies have the opportunity to become global leaders in lithium production and accelerate the transition to sustainable energy sources. This is particularly important as the demand for lithium is increasing every year.
EnergyX is on a mission to meet U.S. lithium demands using groundbreaking technology that can extract 300% more lithium from a source than traditional methods.
You can take advantage of this opportunity by investing in EnergyX and joining other significant players like GM in becoming a shareholder.


-

 Electrification3 years ago
Ranked: The Top 10 EV Battery Manufacturers
-

 Electrification2 years ago
The Key Minerals in an EV Battery
-

 Real Assets3 years ago
The World’s Top 10 Gold Mining Companies
-

 Misc3 years ago
All the Metals We Mined in One Visualization
-

 Electrification3 years ago
The Biggest Mining Companies in the World in 2021
-

 Energy Shift2 years ago
What Are the Five Major Types of Renewable Energy?
-

 Electrification2 years ago
Mapped: Solar Power by Country in 2021
-

 Electrification2 years ago
The World’s Largest Nickel Mining Companies