

Energy Shift
The Clean Energy Employment Shift, by 2030
The Clean Energy Employment Shift, by 2030
With many countries and companies pledged to reduce emissions, the clean energy transition seems to be an inevitability. And that transition will undoubtedly have an impact on employment.
New sources of power don’t just require new and updated equipment, they also require people to operate them. And as demand for cleaner fuels shifts attention away from fossil fuels, it’s likely that not every sector will see a net gain of employment.
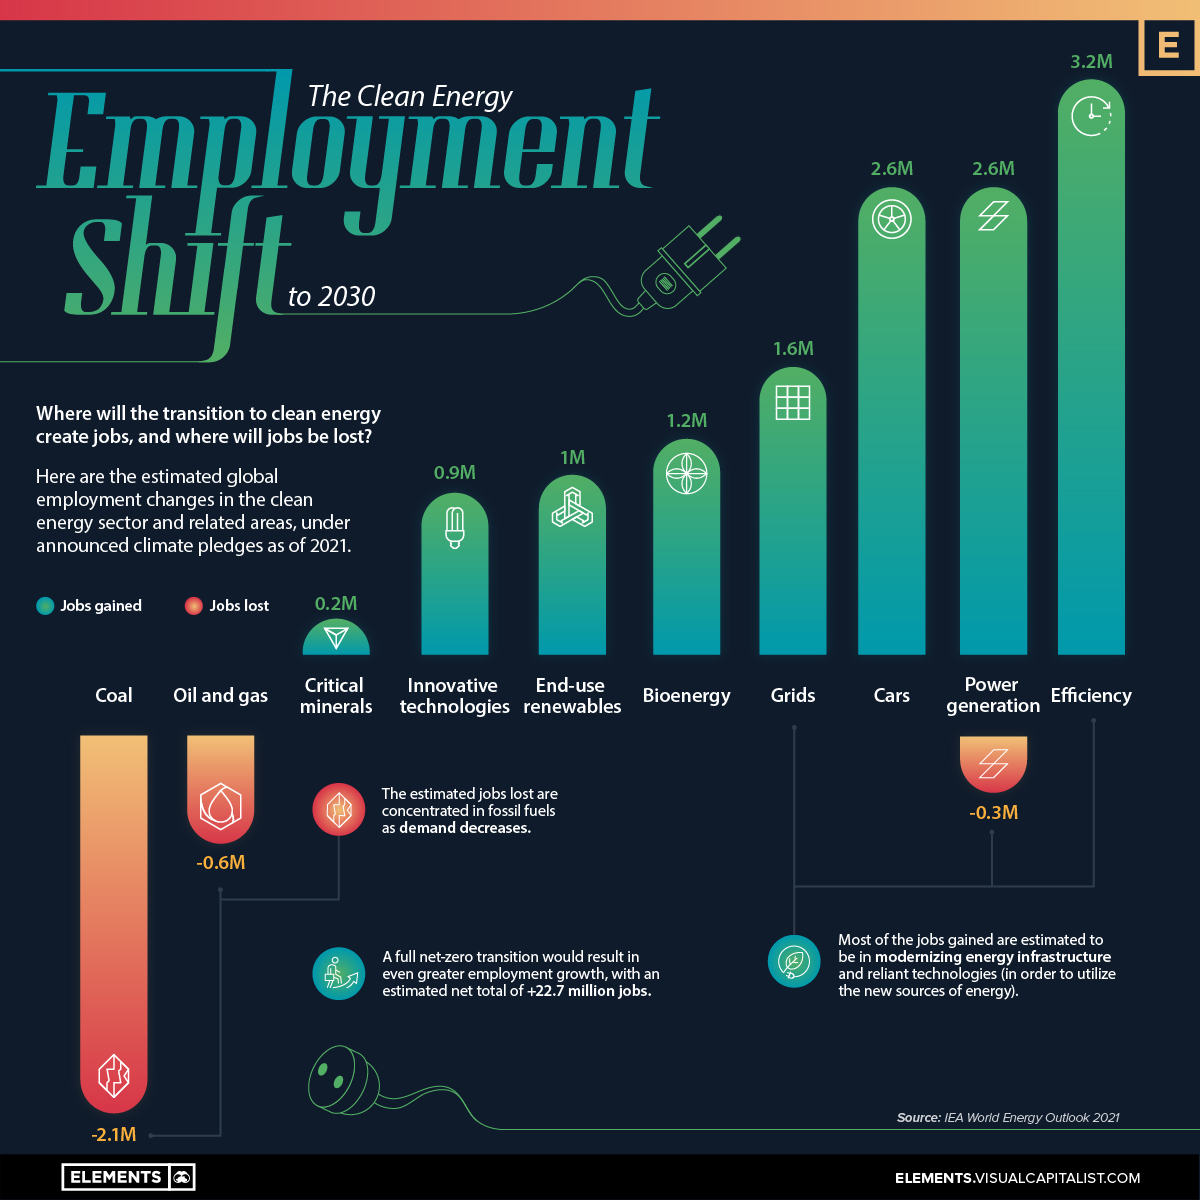
This graphic shows projected global employment growth in the clean energy sector and related areas, under announced climate pledges as of 2021, as tracked by the IEA’s World Energy Outlook.
Which Sectors Will Gain Jobs By 2030?
In total, the clean energy transition is expected to generate 10.3 million net new jobs around the world by 2030.
Though fuel generation will definitely be affected by the clean energy transition, the biggest impact will be felt in modernizing energy infrastructure:
| Clean Energy Jobs By Sector (to 2030) | Jobs Gained | Jobs Lost | Net Job Shift |
|---|---|---|---|
| Efficiency | 3.2M | 0 | 3.2M |
| Cars | 2.6M | 0 | 2.6M |
| Power generation | 2.6M | -0.3M | 2.3M |
| Grids | 1.6M | 0 | 1.6M |
| Bioenergy | 1.2M | 0 | 1.2M |
| End-use renewables | 1M | 0 | 1M |
| Innovative technologies | 0.9M | 0 | 0.9M |
| Critical minerals | 0.2M | 0 | 0.2M |
| Coal | 0 | -0.6M | -0.6M |
| Oil and gas | 0 | -2.1M | -2.1M |
| Total | 13.3M | -3.0M | 10.3M |
In order to properly utilize the new sources of energy, the largest expected job gains are in electrical efficiency, power generation, and the automotive sector. Combined with modernizing the grid, they make up 75% of the 13.3 million in new job gains expected.
Comparatively, new energy sources like bioenergy, end-use renewables, and supply chain resources like innovative technologies and critical minerals combine for 3.3 million jobs. That offsets the 2.7 million jobs expected to be lost in fossil fuel sectors, plus an additional 0.3 million lost in power generation.
But it’s important to note that these expected employment changes are under announced climate pledges as of 2021. The IEA has calculated that in a full net-zero clean energy transition, the estimated quantity of jobs gained and lost would more than double across almost all sectors, with a net addition of 22.7 million new jobs.
Regardless of which path is closest to the reality, it’s clear the job landscape in energy and related sectors will be shifting in the coming years, and it will be interesting to see how and when such changes materialize.


Energy Shift
The World’s Biggest Oil Producers in 2023
Just three countries accounted for 40% of global oil production last year.

The World’s Biggest Oil Producers in 2023
This was originally posted on our Voronoi app. Download the app for free on iOS or Android and discover incredible data-driven charts from a variety of trusted sources.
Despite efforts to decarbonize the global economy, oil still remains one of the world’s most important resources. It’s also produced by a fairly limited group of countries, which can be a source of economic and political leverage.
This graphic illustrates global crude oil production in 2023, measured in million barrels per day, sourced from the U.S. Energy Information Administration (EIA).
Three Countries Account for 40% of Global Oil Production
In 2023, the United States, Russia, and Saudi Arabia collectively contributed 32.7 million barrels per day to global oil production.
| Oil Production 2023 | Million barrels per day |
|---|---|
| 🇺🇸 U.S. | 12.9 |
| 🇷🇺 Russia | 10.1 |
| 🇸🇦 Saudi Arabia | 9.7 |
| 🇨🇦 Canada | 4.6 |
| 🇮🇶 Iraq | 4.3 |
| 🇨🇳 China | 4.2 |
| 🇮🇷 Iran | 3.6 |
| 🇧🇷 Brazil | 3.4 |
| 🇦🇪 UAE | 3.4 |
| 🇰🇼 Kuwait | 2.7 |
| 🌍 Other | 22.8 |
These three nations have consistently dominated oil production since 1971. The leading position, however, has alternated among them over the past five decades.
In contrast, the combined production of the next three largest producers—Canada, Iraq, and China—reached 13.1 million barrels per day in 2023, just surpassing the production of the United States alone.
In the near term, no country is likely to surpass the record production achieved by the U.S. in 2023, as no other producer has ever reached a daily capacity of 13.0 million barrels. Recently, Saudi Arabia’s state-owned Saudi Aramco scrapped plans to increase production capacity to 13.0 million barrels per day by 2027.
In 2024, analysts forecast that the U.S. will maintain its position as the top oil producer. In fact, according to Macquarie Group, U.S. oil production is expected to achieve a record pace of about 14 million barrels per day by the end of the year.
Energy Shift
How Much Does the U.S. Depend on Russian Uranium?
Despite a new uranium ban being discussed in Congress, the U.S. is still heavily dependent on Russian uranium.

How Much Does the U.S. Depend on Russian Uranium?
This was originally posted on our Voronoi app. Download the app for free on iOS or Android and discover incredible data-driven charts from a variety of trusted sources.
The U.S. House of Representatives recently passed a ban on imports of Russian uranium. The bill must pass the Senate before becoming law.
In this graphic, we visualize how much the U.S. relies on Russian uranium, based on data from the United States Energy Information Administration (EIA).
U.S. Suppliers of Enriched Uranium
After Russia invaded Ukraine, the U.S. imposed sanctions on Russian-produced oil and gas—yet Russian-enriched uranium is still being imported.
Currently, Russia is the largest foreign supplier of nuclear power fuel to the United States. In 2022, Russia supplied almost a quarter of the enriched uranium used to fuel America’s fleet of more than 90 commercial reactors.
| Country of enrichment service | SWU* | % |
|---|---|---|
| 🇺🇸 United States | 3,876 | 27.34% |
| 🇷🇺 Russia | 3,409 | 24.04% |
| 🇩🇪 Germany | 1,763 | 12.40% |
| 🇬🇧 United Kingdom | 1,593 | 11.23% |
| 🇳🇱 Netherlands | 1,303 | 9.20% |
| Other | 2,232 | 15.79% |
| Total | 14,176 | 100% |
SWU stands for “Separative Work Unit” in the uranium industry. It is a measure of the amount of work required to separate isotopes of uranium during the enrichment process. Source: U.S. Energy Information Administration
Most of the remaining uranium is imported from European countries, while another portion is produced by a British-Dutch-German consortium operating in the United States called Urenco.
Similarly, nearly a dozen countries around the world depend on Russia for more than half of their enriched uranium—and many of them are NATO-allied members and allies of Ukraine.
In 2023 alone, the U.S. nuclear industry paid over $800 million to Russia’s state-owned nuclear energy corporation, Rosatom, and its fuel subsidiaries.
It is important to note that 19% of electricity in the U.S. is powered by nuclear plants.
The dependency on Russian fuels dates back to the 1990s when the United States turned away from its own enrichment capabilities in favor of using down-blended stocks of Soviet-era weapons-grade uranium.
As part of the new uranium-ban bill, the Biden administration plans to allocate $2.2 billion for the expansion of uranium enrichment facilities in the United States.

-

 Electrification3 years ago
Ranked: The Top 10 EV Battery Manufacturers
-

 Electrification2 years ago
The Key Minerals in an EV Battery
-

 Real Assets2 years ago
The World’s Top 10 Gold Mining Companies
-

 Misc3 years ago
All the Metals We Mined in One Visualization
-

 Electrification3 years ago
The Biggest Mining Companies in the World in 2021
-

 Energy Shift2 years ago
What Are the Five Major Types of Renewable Energy?
-

 Electrification2 years ago
The World’s Largest Nickel Mining Companies
-

 Electrification2 years ago
Mapped: Solar Power by Country in 2021