

Energy Shift
Charted: $5 Trillion in Fossil Fuel Subsidies
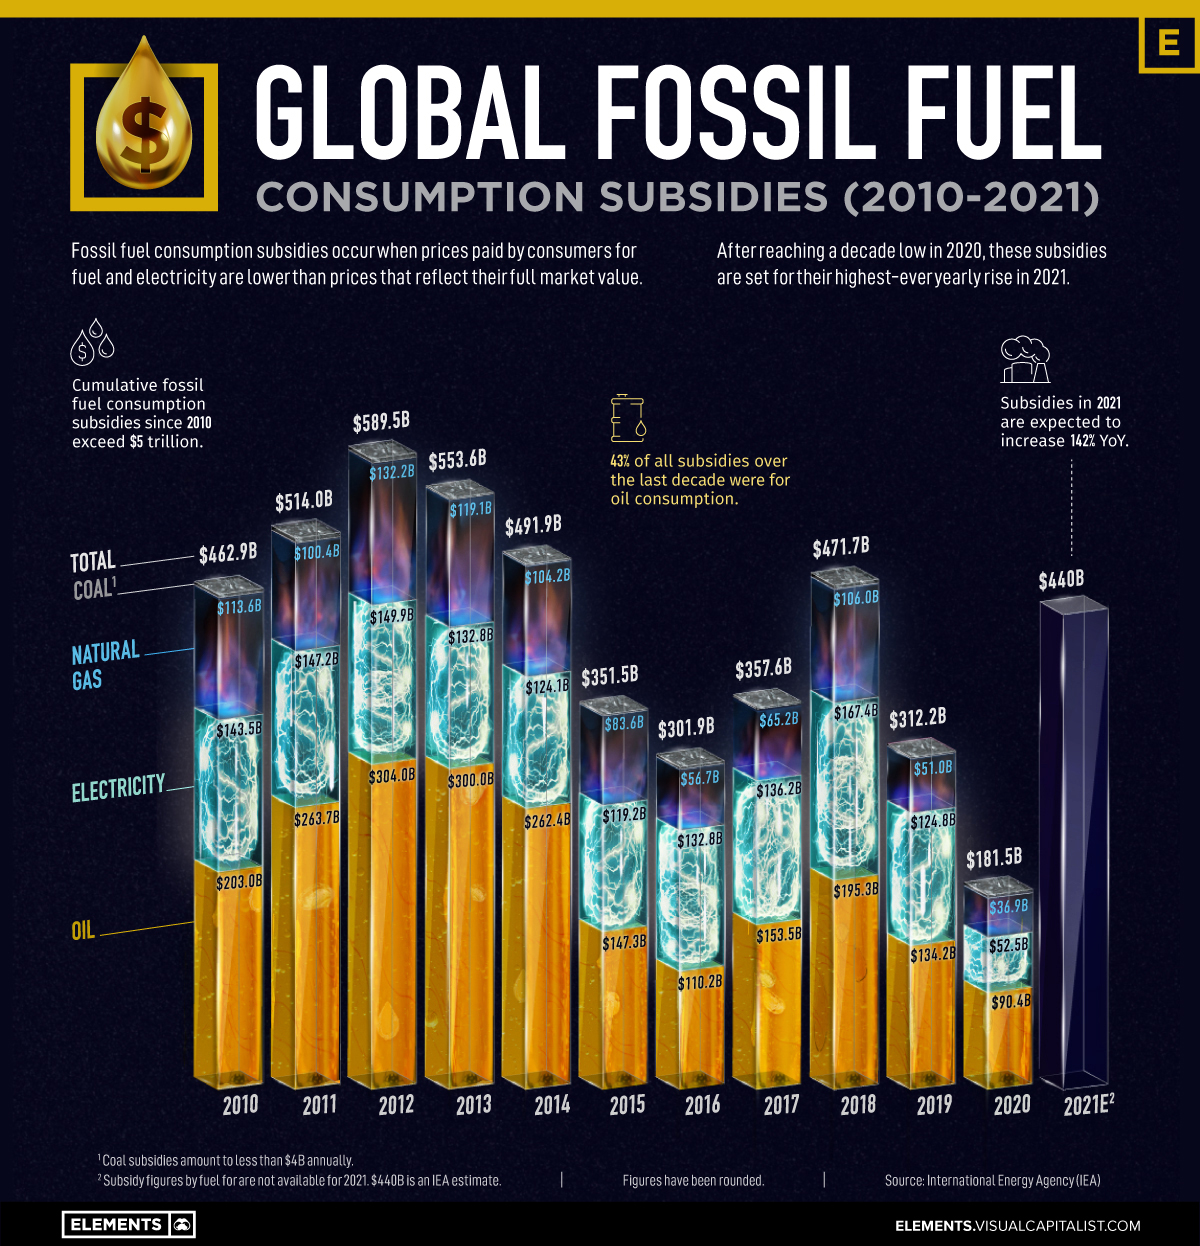
Charted: $5 Trillion in Fossil Fuel Subsidies (2010-2021)
With energy consumption vital for life and business, governments often look to fossil fuel subsidies to make energy as affordable as possible.
These subsidies artificially reduce the price of fossil fuels and generally take two forms:
- Production subsidies occur when governments provide tax cuts or direct payments that reduce the cost of producing coal, oil, or gas.
- Consumption subsidies cut fuel prices for the end-user through price controls and other such measures.
Each year, governments around the world pour nearly half a trillion dollars into fossil fuel subsidies. This chart breaks down a decade of fossil fuel consumption subsidies by energy source using data from the International Energy Agency (IEA).
Breaking Down Fossil Fuel Consumption Subsidies
Since 2010, governments have spent over $5 trillion in fossil fuel consumption subsidies. The majority of this sum went towards making oil more affordable, as seen below:
| Subsidies by Year (US$) | Oil | Electricity | Natural Gas | Coal | Total |
|---|---|---|---|---|---|
| 2010 | $203.0B | $143.5B | $113.6B | $2.7B | $462.9B |
| 2011 | $263.7B | $147.2B | $100.4B | $3.6B | $514.0B |
| 2012 | $304.0B | $149.9B | $132.2B | $3.3B | $589.5B |
| 2013 | $300.0B | $132.8B | $119.1B | $1.7B | $553.6B |
| 2014 | $262.4B | $124.1B | $104.2B | $1.1B | $491.9B |
| 2015 | $147.3B | $119.2B | $83.6B | $1.5B | $351.5B |
| 2016 | $110.2B | $132.8B | $56.7B | $2.2B | $301.9B |
| 2017 | $153.5B | $136.2B | $65.2B | $2.7B | $357.6B |
| 2018 | $195.3B | $167.4B | $106.0B | $3.0B | $471.7B |
| 2019 | $134.2B | $124.8B | $51.0B | $2.2B | $312.2B |
| 2020 | $90.4B | $52.5B | $36.9B | $1.7B | $181.5B |
| Total | $2,164.0B | $1,430.4B | $968.9B | $25.7B | $4,588.3B |
Fossil fuel subsidies fell to a decade low in 2020 as the pandemic hampered fuel consumption and triggered a nosedive in oil prices. However, after two years of straight declines, the IEA estimates that governments around the world spent $440 billion on subsidizing fossil fuel consumption over 2021, representing a 142% rise year-over-year.
Breaking down the subsidies by fuel, oil accounts for 43% or over $2 trillion of all subsidies between 2010 and 2020. Together, oil and electricity generated by fossil fuels received nearly 75% of all subsidies.
Despite growing support for the clean energy transition, the fossil fuel industry reaps the benefits of billions in subsidies annually—but why?
Why Do Governments Subsidize Fossil Fuels?
High energy prices can have rippling effects throughout an economy.
For consumers, heating and transportation become more expensive. And for producers who use energy and oil as inputs, the cost of goods and services goes up.
Often, governments turn to energy subsidies to keep prices down and encourage economic activity. Therefore, there’s a high cost to removing these subsidies, especially in developing countries where large parts of the population might lack access to affordable energy.
But fossil fuel subsidies can also have detrimental effects. By artificially lowering prices, they can encourage overconsumption of carbon-intense fuels, creating negative externalities through adverse environmental and health impacts. According to the International Renewable Energy Agency, these add up to an amount anywhere between $2.6 to $8.1 trillion globally.
Despite these disadvantages, fossil fuels remain an important part of the global energy mix, with continued support from governments. And with energy prices soaring, 2022 could be another year of billions in fossil fuel subsidies.


Energy Shift
The World’s Biggest Oil Producers in 2023
Just three countries accounted for 40% of global oil production last year.

The World’s Biggest Oil Producers in 2023
This was originally posted on our Voronoi app. Download the app for free on iOS or Android and discover incredible data-driven charts from a variety of trusted sources.
Despite efforts to decarbonize the global economy, oil still remains one of the world’s most important resources. It’s also produced by a fairly limited group of countries, which can be a source of economic and political leverage.
This graphic illustrates global crude oil production in 2023, measured in million barrels per day, sourced from the U.S. Energy Information Administration (EIA).
Three Countries Account for 40% of Global Oil Production
In 2023, the United States, Russia, and Saudi Arabia collectively contributed 32.7 million barrels per day to global oil production.
| Oil Production 2023 | Million barrels per day |
|---|---|
| 🇺🇸 U.S. | 12.9 |
| 🇷🇺 Russia | 10.1 |
| 🇸🇦 Saudi Arabia | 9.7 |
| 🇨🇦 Canada | 4.6 |
| 🇮🇶 Iraq | 4.3 |
| 🇨🇳 China | 4.2 |
| 🇮🇷 Iran | 3.6 |
| 🇧🇷 Brazil | 3.4 |
| 🇦🇪 UAE | 3.4 |
| 🇰🇼 Kuwait | 2.7 |
| 🌍 Other | 22.8 |
These three nations have consistently dominated oil production since 1971. The leading position, however, has alternated among them over the past five decades.
In contrast, the combined production of the next three largest producers—Canada, Iraq, and China—reached 13.1 million barrels per day in 2023, just surpassing the production of the United States alone.
In the near term, no country is likely to surpass the record production achieved by the U.S. in 2023, as no other producer has ever reached a daily capacity of 13.0 million barrels. Recently, Saudi Arabia’s state-owned Saudi Aramco scrapped plans to increase production capacity to 13.0 million barrels per day by 2027.
In 2024, analysts forecast that the U.S. will maintain its position as the top oil producer. In fact, according to Macquarie Group, U.S. oil production is expected to achieve a record pace of about 14 million barrels per day by the end of the year.
Energy Shift
How Much Does the U.S. Depend on Russian Uranium?
Despite a new uranium ban being discussed in Congress, the U.S. is still heavily dependent on Russian uranium.

How Much Does the U.S. Depend on Russian Uranium?
This was originally posted on our Voronoi app. Download the app for free on iOS or Android and discover incredible data-driven charts from a variety of trusted sources.
The U.S. House of Representatives recently passed a ban on imports of Russian uranium. The bill must pass the Senate before becoming law.
In this graphic, we visualize how much the U.S. relies on Russian uranium, based on data from the United States Energy Information Administration (EIA).
U.S. Suppliers of Enriched Uranium
After Russia invaded Ukraine, the U.S. imposed sanctions on Russian-produced oil and gas—yet Russian-enriched uranium is still being imported.
Currently, Russia is the largest foreign supplier of nuclear power fuel to the United States. In 2022, Russia supplied almost a quarter of the enriched uranium used to fuel America’s fleet of more than 90 commercial reactors.
| Country of enrichment service | SWU* | % |
|---|---|---|
| 🇺🇸 United States | 3,876 | 27.34% |
| 🇷🇺 Russia | 3,409 | 24.04% |
| 🇩🇪 Germany | 1,763 | 12.40% |
| 🇬🇧 United Kingdom | 1,593 | 11.23% |
| 🇳🇱 Netherlands | 1,303 | 9.20% |
| Other | 2,232 | 15.79% |
| Total | 14,176 | 100% |
SWU stands for “Separative Work Unit” in the uranium industry. It is a measure of the amount of work required to separate isotopes of uranium during the enrichment process. Source: U.S. Energy Information Administration
Most of the remaining uranium is imported from European countries, while another portion is produced by a British-Dutch-German consortium operating in the United States called Urenco.
Similarly, nearly a dozen countries around the world depend on Russia for more than half of their enriched uranium—and many of them are NATO-allied members and allies of Ukraine.
In 2023 alone, the U.S. nuclear industry paid over $800 million to Russia’s state-owned nuclear energy corporation, Rosatom, and its fuel subsidiaries.
It is important to note that 19% of electricity in the U.S. is powered by nuclear plants.
The dependency on Russian fuels dates back to the 1990s when the United States turned away from its own enrichment capabilities in favor of using down-blended stocks of Soviet-era weapons-grade uranium.
As part of the new uranium-ban bill, the Biden administration plans to allocate $2.2 billion for the expansion of uranium enrichment facilities in the United States.

-

 Electrification3 years ago
Ranked: The Top 10 EV Battery Manufacturers
-

 Electrification2 years ago
The Key Minerals in an EV Battery
-

 Real Assets3 years ago
The World’s Top 10 Gold Mining Companies
-

 Misc3 years ago
All the Metals We Mined in One Visualization
-

 Electrification3 years ago
The Biggest Mining Companies in the World in 2021
-

 Energy Shift2 years ago
What Are the Five Major Types of Renewable Energy?
-

 Electrification2 years ago
The World’s Largest Nickel Mining Companies
-

 Electrification2 years ago
Mapped: Solar Power by Country in 2021