

Misc
Visualizing the Abundance of Elements in the Earth’s Crust


Visualizing the Abundance of Elements in the Earth’s Crust
Elements in the Earth’s crust provide all the basic building blocks for mankind.
But even though the crust is the source of everything we find, mine, refine, and build, it really is just scratching the surface of our planet.
After all, the innermost layer of the Earth, the core, represents 15% of the planet’s volume, whereas the mantle occupies 84%. Representing the remaining 1% is the crust, a thin layer that ranges in depth from approximately 5-70 km (~3-44 miles).
This infographic takes a look at what elements make up this 1%, based on data from WorldAtlas.
Earth’s Crust Elements
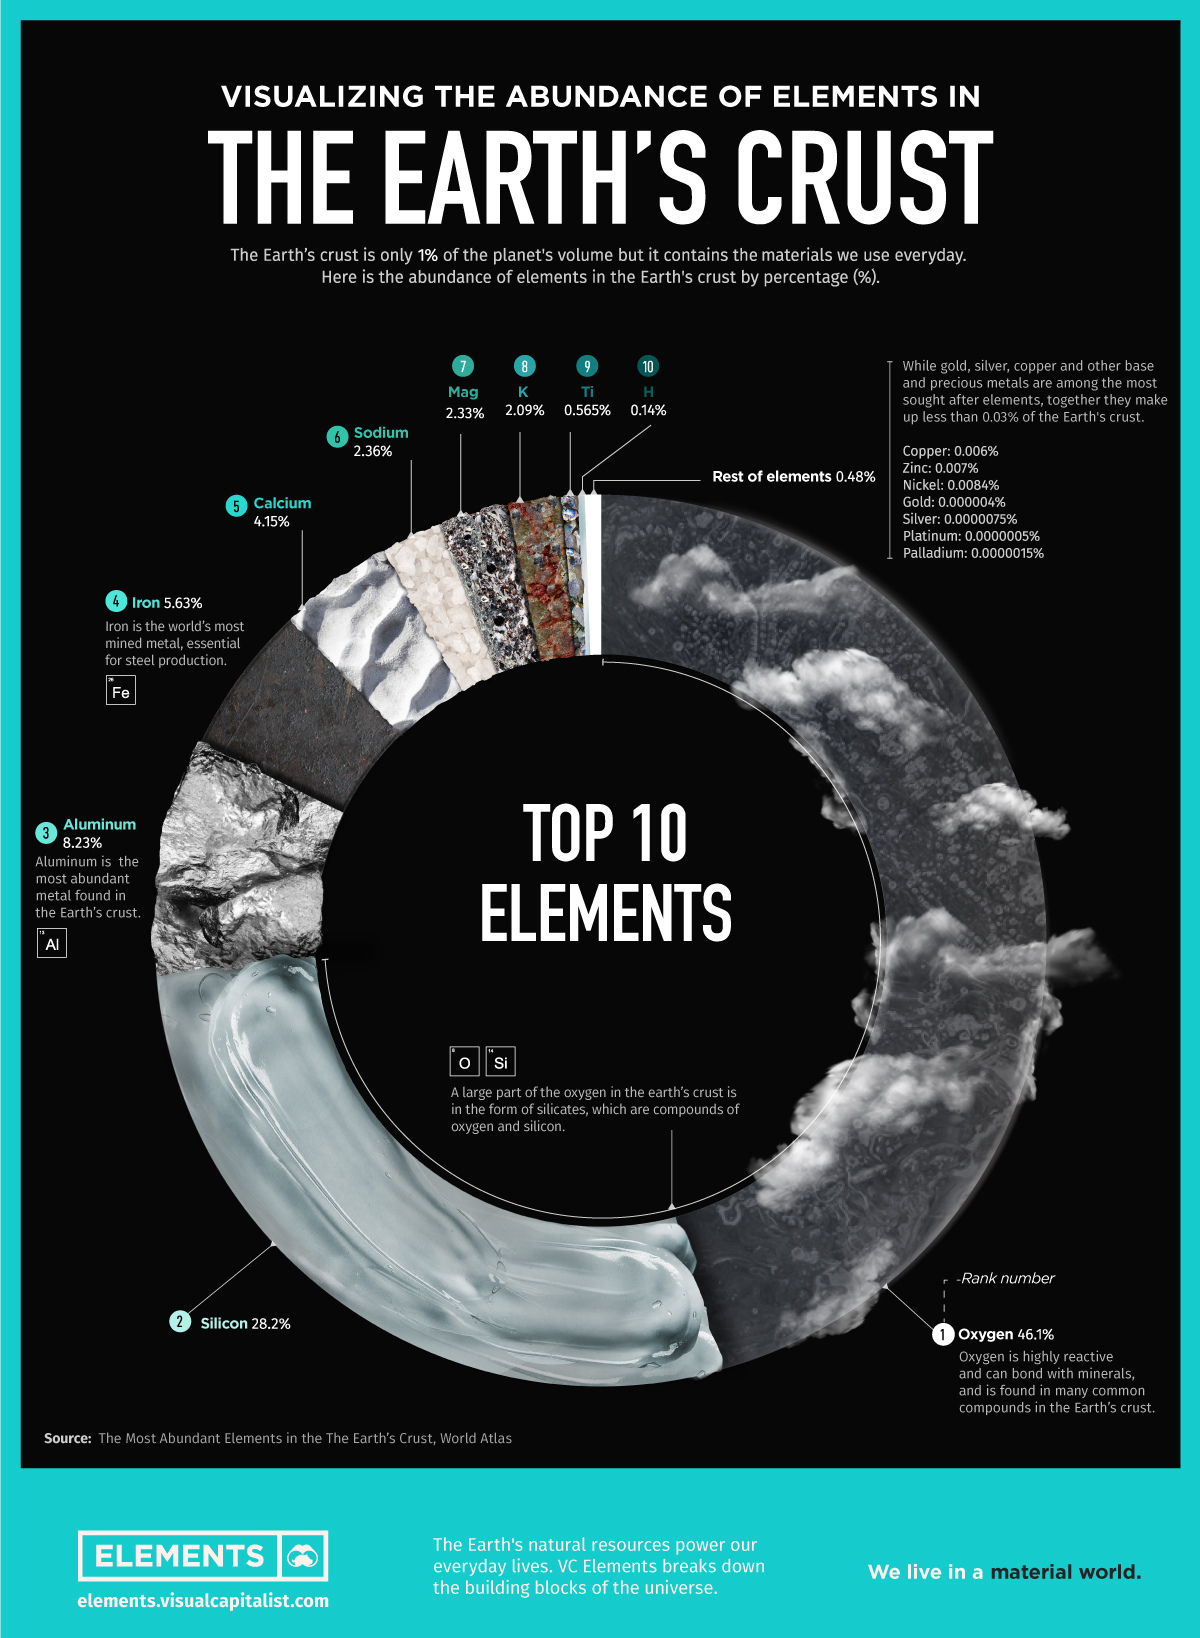
The crust is a rigid surface containing both the oceans and landmasses. Most elements are found in only trace amounts within the Earth’s crust, but several are abundant.
The Earth’s crust comprises about 95% igneous and metamorphic rocks, 4% shale, 0.75% sandstone, and 0.25% limestone.
Oxygen, silicon, aluminum, and iron account for 88.1% of the mass of the Earth’s crust, while another 90 elements make up the remaining 11.9%.
| Rank | Element | % of Earth's Crust |
|---|---|---|
| 1 | Oxygen (O) | 46.1% |
| 2 | Silicon (Si) | 28.2% |
| 3 | Aluminum (Al) | 8.2% |
| 4 | Iron (Fe) | 5.6% |
| 5 | Calcium (Ca) | 4.1% |
| 6 | Sodium (Na) | 2.3% |
| 7 | Magnesium (Mg) | 2.3% |
| 8 | Potassium (K) | 2.0% |
| 9 | Titanium (Ti) | 0.5% |
| 10 | Hydrogen (H) | 0.1% |
| Other elements | 0.5% | |
| Total | 100.0% |
While gold, silver, copper and other base and precious metals are among the most sought after elements, together they make up less than 0.03% of the Earth’s crust by mass.
#1: Oxygen
Oxygen is by far the most abundant element in the Earth’s crust, making up 46% of mass—coming up just short of half of the total.
Oxygen is a highly reactive element that combines with other elements, forming oxides. Some examples of common oxides are minerals such as granite and quartz (oxides of silicon), rust (oxides of iron), and limestone (oxide of calcium and carbon).
#2: Silicon
More than 90% of the Earth’s crust is composed of silicate minerals, making silicon the second most abundant element in the Earth’s crust.
Silicon links up with oxygen to form the most common minerals on Earth. For example, in most places, sand primarily consists of silica (silicon dioxide) usually in the form of quartz. Silicon is an essential semiconductor, used in manufacturing electronics and computer chips.
#3: Aluminum
Aluminum is the third most common element in the Earth’s crust.
Because of its strong affinity for oxygen, aluminum is rarely found in its elemental state. Aluminum oxide (Al2O3), aluminum hydroxide (Al(OH)3) and potassium aluminum sulphate (KAl(SO4)2) are common aluminum compounds.
Aluminum and aluminum alloys have a variety of uses, from kitchen foil to rocket manufacturing.
#4: Iron
The fourth most common element in the Earth’s crust is iron, accounting for over 5% of the mass of the Earth’s crust.
Iron is obtained chiefly from the minerals hematite and magnetite. Of all the metals we mine, over 90% is iron, mainly to make steel, an alloy of carbon and iron. Iron is also an essential nutrient in the human body.
#5: Calcium
Calcium makes up about 4.2% of the planet’s crust by weight.
In its pure elemental state, calcium is a soft, silvery-white alkaline earth metal. It is never found in its isolated state in nature but exists instead in compounds. Calcium compounds can be found in a variety of minerals, including limestone (calcium carbonate), gypsum (calcium sulphate) and fluorite (calcium fluoride).
Calcium compounds are widely used in the food and pharmaceutical industries for supplementation. They are also used as bleaches in the paper industry, as components in cement and electrical insulators, and in manufacturing soaps.
Digging the Earth’s Crust
Despite Jules Verne’s novel, no one has ever journeyed to the center of Earth.
In fact, the deepest hole ever dug by humanity reaches approximately 12 km (7.5 miles) below the Earth’s surface, about one-third of the way to the Earth’s mantle. This incredible depth took about 20 years to reach.
Although mankind is constantly making new discoveries and reaching for the stars, there is still a lot to explore about the Earth we stand on.


Misc
Brass Rods: The Secure Choice
This graphic shows why brass rods are the secure choice for precision-machined and forged parts.

Brass Rods: The Secure Choice
The unique combination of machinability and recyclability makes brass rods the secure choice for manufacturers seeking future-proof raw material solutions.
This infographic, from the Copper Development Association, shows three ways brass rods give manufacturers greater control and a license to grow in the competitive market for precision-machined and forged products.
Future-Proof Investments in New Machine Tools
A material’s machinability directly impacts machine throughput, which typically has the largest impact on machine shop profitability.
The high-speed machining capabilities of brass rods maximize machine tool performance, allowing manufacturers to run the material faster and longer without sacrificing tool life, chip formation, or surface quality.
The high machining efficiency of brass leads to reduced per-part costs, quicker return on investment (ROI) for new machine tools, and expanded production capacity for new projects.
Supply Security Through Closed Loop Recycling
Brass, like its parent element copper, can be infinitely recycled.
In 2022, brass- and wire-rod mills accounted for the majority of the 830,000 tonnes of copper recycled from scrap in the U.S.
Given that scrap ratios for machined parts typically range from 60-70% by weight, producing mills benefit from a secure and steady supply of clean scrap returned directly from customers, which is recycled to create new brass rods.
The high residual value of brass scrap creates a strong recycling incentive. Scrap buy back programs give manufacturers greater control over raw material net costs as scrap value is often factored into supplier purchase agreements.
Next Generation Alloys for a Lead-Free Future
Increasingly stringent global regulations continue to pressure manufacturers to minimize the use of materials containing trace amounts of lead and other harmful impurities.
The latest generation of brass-rod alloys is engineered to meet the most demanding criteria for lead leaching in drinking water and other sensitive applications.
Seven brass-rod alloys passed rigorous testing to become the only ‘Acceptable Materials’ against lower lead leaching criteria recently adopted in the national U.S. drinking water quality standard, NSF 61.
Learn more about the advantages of brass rods solutions.
Misc
Brass Rods: The Safe Choice
From airbags to firefighting equipment, components made from brass rods play a vital role in creating a safer environment.

Brass Rods: The Safe Choice
From airbags to firefighting equipment, components made from brass rods play a vital role in creating a safer environment.
This infographic from the Copper Development Association illustrates three use cases for brass. This is the first of three infographics in our Choose Brass series.
Why Brass?
Brass is one of the most reliable metals for industrial and other applications. It contains little to no iron, protecting it from oxidation, which can cause other materials to fail over time.
Additionally, the malleability of brass ensures tight and leak-free metal-to-metal seals for threaded joints, minimizing the risk of costly and dangerous system failures. Brass’s durability ensures critical system components function properly for years.
Brass for Safe Water Systems
Exposure to lead in water can cause various health problems, including neurological damage, developmental delays, and cardiovascular diseases.
As a result, the U.S. sets minimum health-effect requirements for chemical contaminants and impurities indirectly transferred to drinking water from products, components, and materials used in water systems.
Currently, only brass rod alloys are designated as “acceptable materials” according to national standards.
Brass is also essential for ensuring workplace safety, particularly in high-risk manufacturing environments.
Using Brass for Safe Manufacturing and Industrial Environments
Brass is used extensively in industrial applications such as machinery components, valves, fittings, architectural elements, bearings, and gears.
The machinability of brass rods also means longer tool life and higher productivity for manufacturers of precision parts.
The microstructure of brass helps break up metal chips generated during machining operations, preventing long and stringy chips that can crash machines and seriously injure operators.
Additionally, brass’s non-sparking properties make it ideal for tooling, fittings, and components in high-risk industries such as oil & gas, chemicals, pharmaceuticals, paint manufacturing, power plants, and explosives.
Brass for Safer Communities
Many pieces of equipment in our daily lives also rely on brass rod parts to function. Control valves in gas stoves, BBQs, and home furnaces made from brass rods reduce the risk of deadly gas leaks and fires.
Moreover, brass is ideal for firefighting equipment due to its corrosion resistance, durability, heat resistance, and non-sparking properties.
Fittings made from brass rods ensure that the brakes and airbags in our vehicles work when needed.
Brass and other copper-based alloys are also naturally antimicrobial, helping prevent diseases when used in high-touch surfaces such as door handles.
These are only some of the ways that brass rods help build a safer world for everyone.
Explore the Advantages of Brass Rod Solutions.

-

 Electrification3 years ago
Ranked: The Top 10 EV Battery Manufacturers
-

 Electrification2 years ago
The Key Minerals in an EV Battery
-

 Real Assets3 years ago
The World’s Top 10 Gold Mining Companies
-

 Misc3 years ago
All the Metals We Mined in One Visualization
-

 Electrification3 years ago
The Biggest Mining Companies in the World in 2021
-

 Energy Shift2 years ago
What Are the Five Major Types of Renewable Energy?
-

 Electrification2 years ago
Mapped: Solar Power by Country in 2021
-

 Electrification2 years ago
The World’s Largest Nickel Mining Companies