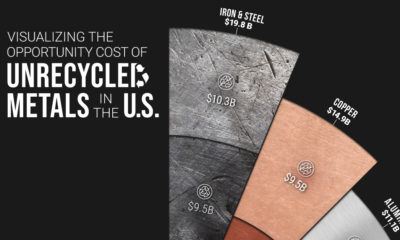

Exploring the quantity and dollar value of recycled metals in the U.S. by visualizing metal recycling ratios.
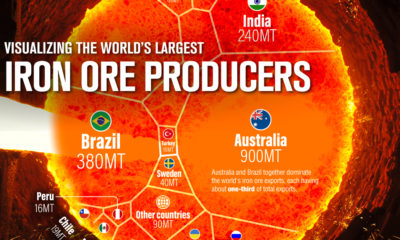

Iron ore made up 93% of the 2.7 billion tonnes of metals mined in 2021. This infographic lists the world’s largest iron ore producers.
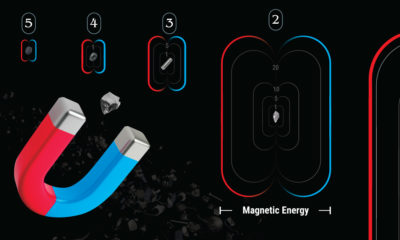

Rare earth magnets are the most powerful magnets in the world. How does their strength compare with other common magnets?


Which key minerals power the lithium-ion batteries in electric vehicles?
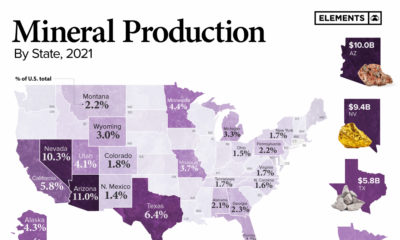

This infographic breaks down $90.4 billion in non-fuel mineral production by state.
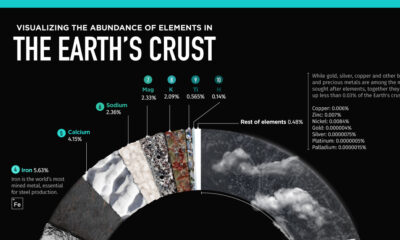

The Earth's crust makes up 1% of the planet's volume, but provides all the material we use. What elements make up this thin layer we stand...
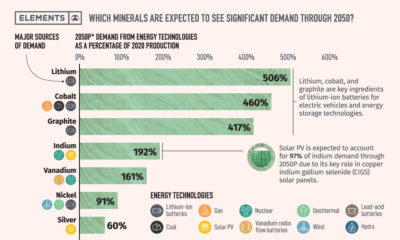

Energy technologies are often mineral-intensive. This chart shows how the energy shift is creating massive demand for minerals.
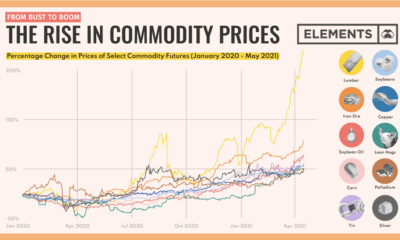

Commodity prices have been on the uptrend since 2020. This chart shows 10 commodities with significant price increases over the last year.
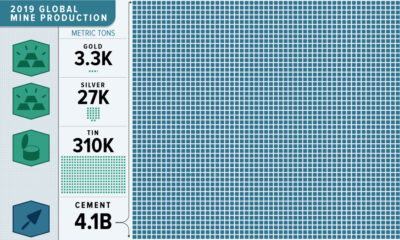

This massive infographic reveals the dramatic scale of 2019 non-fuel mineral global production.
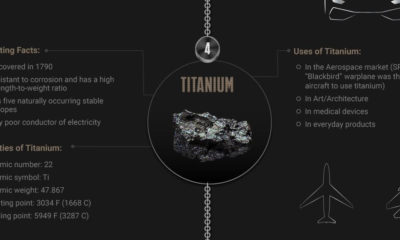

There are 91 elements that are defined as metals but not all are the same. Here is a breakdown of the top 10 strongest metals and...