

Misc
Visualizing Ukraine’s Top Trading Partners and Products
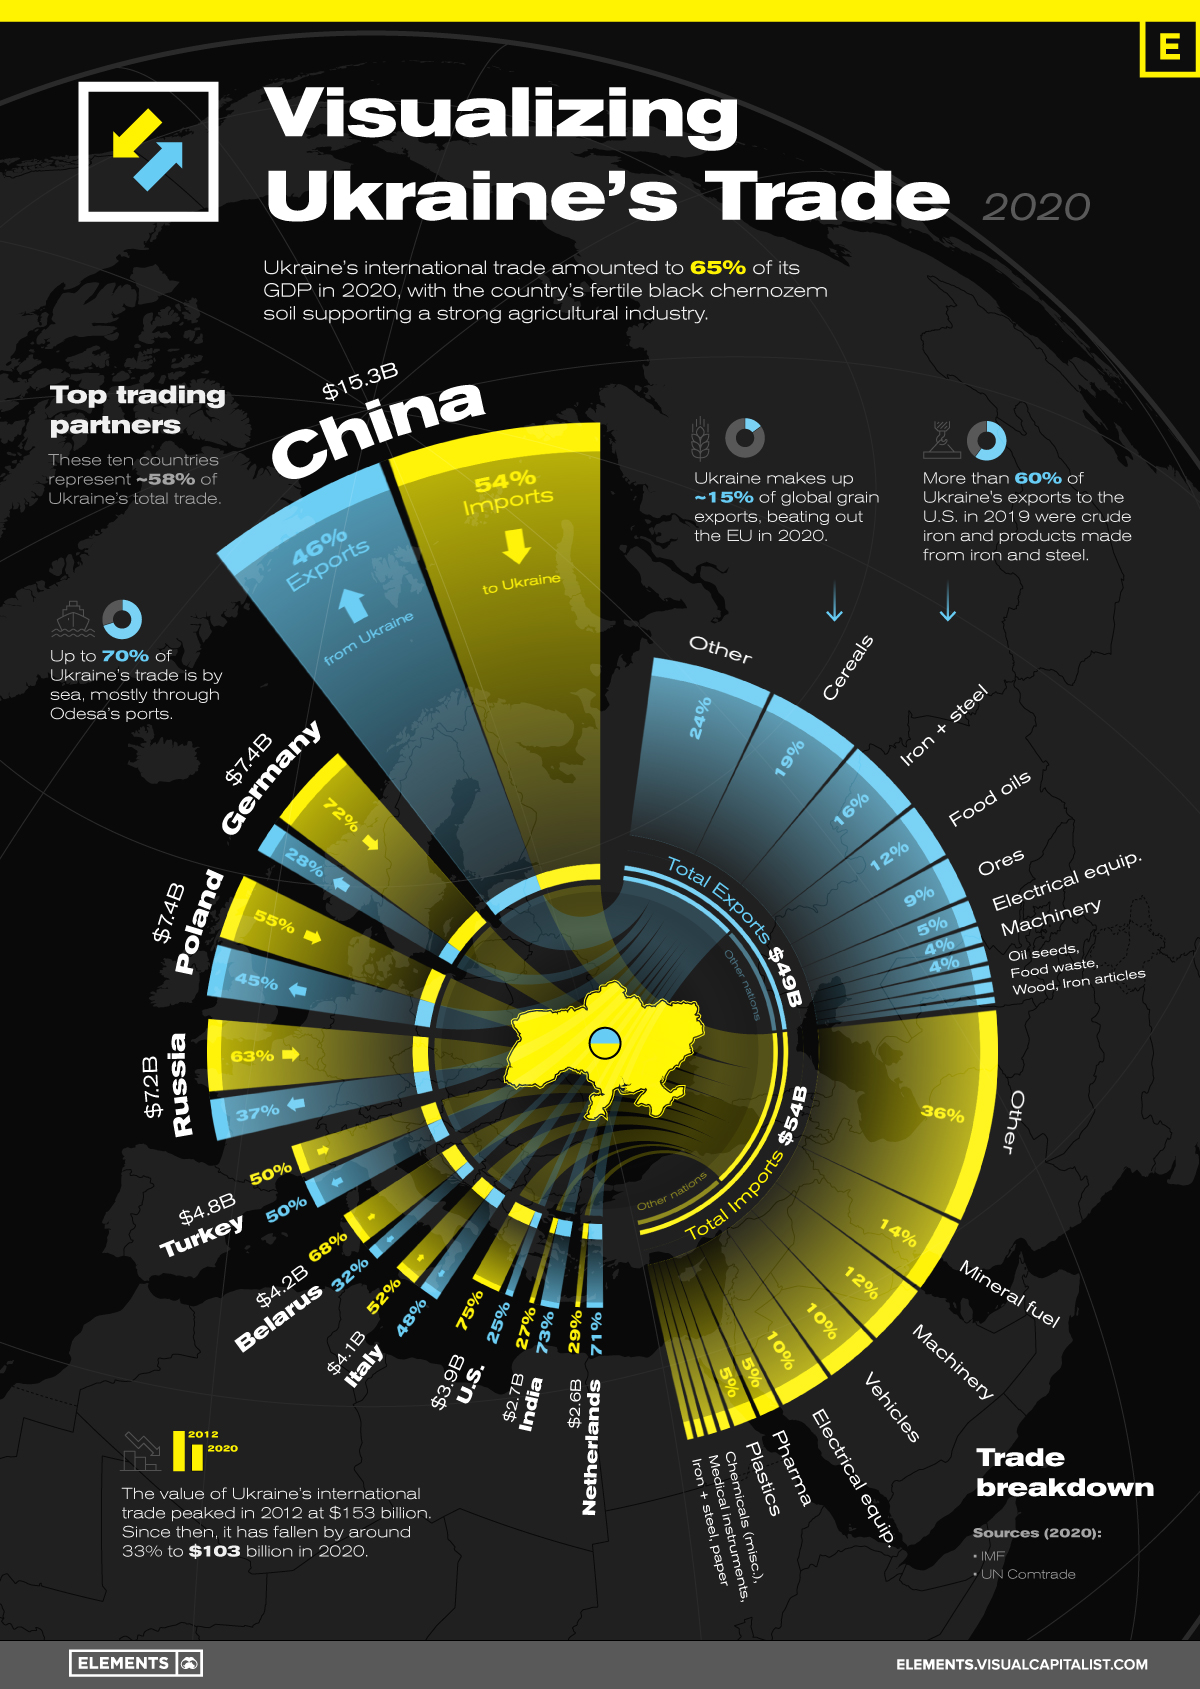
Visualizing Ukraine’s Top Trading Partners and Products
International trade was equal to 65% of Ukraine’s GDP in 2020, totaling to $102.9 billion of goods exchanged with countries around the world.
In 2014, Russia’s annexation of Crimea contributed to a 30% year-over-year drop in Ukraine’s 2015 trade value ($75.6B). Now, Ukraine’s international trade has been irreversibly disrupted since Russia’s full-scale invasion on February 24th, 2022.
The current conflict continues to reshape geopolitical relations and international trade—and to give context to the situation, we’ve created this graphic using IMF and UN Comtrade data to showcase Ukraine’s largest trading partners and goods traded in 2020.
Ukraine’s Largest Trading Partners
Ukraine’s largest trading partner in 2020 was China, with the value of trade between the two countries reaching $15.3 billion, more than double the value of any other trading partner.
Germany ($7.4B), Poland ($7.4B), and Russia ($7.2B) were Ukraine’s next three largest trading partners, with the majority of Ukraine’s trade with these countries being imports.
| Country | Trade with Ukraine (2020) | Exports from Ukraine (%) | Imports to Ukraine (%) |
|---|---|---|---|
| 🇨🇳 China | $15.3B | 46% | 54% |
| 🇩🇪 Germany | $7.4B | 28% | 72% |
| 🇵🇱 Poland | $7.4B | 45% | 55% |
| 🇷🇺 Russia | $7.2B | 37% | 63% |
| 🇹🇷 Turkey | $4.8B | 50% | 50% |
| 🇧🇾 Belarus | $4.2B | 32% | 68% |
| 🇮🇹 Italy | $4.1B | 48% | 52% |
| 🇺🇸 U.S. | $3.9B | 25% | 75% |
| 🇮🇳 India | $2.7B | 73% | 27% |
| 🇳🇱 Netherlands | $2.6B | 71% | 29% |
Source: IMF
While most of Ukraine’s trade with top partners is made up of imports, trade with both India and the Netherlands (Ukraine’s ninth and tenth largest trading partners respectively) was more export driven, with exports holding a greater than 70% share of total trade value.
Ukraine’s Top Exports and Imports
Ukraine’s strong agricultural industry makes up a large share of the country’s exports in the form of cereals, animal and vegetable oils, and seed oils. These products made up nearly 35% of Ukraine’s exports in 2020, at a value of $17 billion collectively.
| Goods Exported from Ukraine (2020) | Dollar Value | Share of Exports |
|---|---|---|
| Cereals | $9.4B | 19.1% |
| Iron and steel | $7.7B | 15.6% |
| Animal or vegetable fats, oils, and other products | $5.8B | 11.7% |
| Ores, slag, and ash | $4.4B | 8.9% |
| Electrical machinery and equipment | $2.6B | 5.2% |
| Other goods | $19.4B | 39.5% |
Source: UN Comtrade
The other two cornerstones of Ukraine’s industry and exports are iron ore and steel, along with refined electrical machinery, equipment, and other mechanical appliances. In 2020, exports of crude iron and steel along with their refined products made up $13 billion in value, making up more than a quarter of Ukraine’s exports.
Ukraine’s imports are primarily vehicles, machinery, and the fuels necessary to power these goods. With the country’s energy consumption outpacing domestic energy production, mineral fuels and oils are Ukraine’s top import in 2020 at $7.42 billion.
| Goods Imported from Ukraine (2020) | Dollar Value | Share of Imports |
|---|---|---|
| Mineral fuels, oil, and mineral products | $7.4B | 13.8% |
| Boilers, machinery and mechanical appliances | $6.3B | 11.7% |
| Vehicles other than railway or tramway rolling stock | $5.5B | 10.2% |
| Electrical machinery and equipment | $5.3B | 9.9% |
| Pharmaceutical products | $2.5B | 4.7% |
| Other goods | $26.6B | 49.7% |
Source: UN Comtrade
Primarily importing from Belarus, Russia, and Germany, Ukraine’s need for energy fuels was greatly exacerbated by Russia’s annexation of the Crimean peninsula, which held 80% of Ukraine’s oil and natural gas deposits in the Black Sea.
Various kinds of machinery, vehicles, and electrical equipment are the next largest categories of goods imported, cumulatively making up 31% ($17.1B) of Ukraine’s imports.
Ukraine’s Shift Away from Russian Trade Dependence
Since its independence from the former USSR in 1991, Ukraine has steadily shifted towards Western trading partners, especially as conflicts with Russia escalated in the 2010s.
After years of negotiations, Ukraine’s Association Agreement with the EU in 2014 facilitated free trade between EU nations and Ukraine, reducing the country’s dependence on trade with Russia.
Ukraine is one of the most important economic centers of the former Soviet Union, and it had long been the breadbasket of the USSR thanks to its fertile chernozem soil and strong agricultural industry.
Trade value between Russia and Ukraine peaked in 2011 at $49.2 billion, and since then has fallen by 85% to $7.2 billion in 2020. During this time, European nations like Poland and Germany overtook Russia in terms of trade value with Ukraine, and in 2021 trade with the EU totaled to more than $58 billion.
War’s Effect on Ukraine’s Future Trading Partners
Russia’s invasion of Ukraine is rapidly reshaping both countries’ international relations and trading partners.
Four days into the recent conflict, Ukrainian President Zelenskyy filed for Ukraine’s special admission into the EU, which would further strengthen Ukraine’s trade with European Union members. Combining the likely breakdown of Ukrainian-Russian trade with China’s lack of condemnation of Russia’s actions, Ukraine’s trade seems likely to continue shifting towards the European Union and its Western allies.
While not exactly international trade, on February 26th the U.S. committed an additional $350 million in support to Ukraine, with American financial security assistance to Ukraine totaling $1 billion over the past year. Alongside the U.S., the EU recently committed €500 million in financial support, and multiple EU and non-EU nations are providing Ukraine with military aid.
Although it’s impossible to determine the results of this conflict and its effects on international trade, the countries supporting Ukraine’s defense today are likely to become the Ukraine’s top trading partners in the future.


Misc
Brass Rods: The Secure Choice
This graphic shows why brass rods are the secure choice for precision-machined and forged parts.

Brass Rods: The Secure Choice
The unique combination of machinability and recyclability makes brass rods the secure choice for manufacturers seeking future-proof raw material solutions.
This infographic, from the Copper Development Association, shows three ways brass rods give manufacturers greater control and a license to grow in the competitive market for precision-machined and forged products.
Future-Proof Investments in New Machine Tools
A material’s machinability directly impacts machine throughput, which typically has the largest impact on machine shop profitability.
The high-speed machining capabilities of brass rods maximize machine tool performance, allowing manufacturers to run the material faster and longer without sacrificing tool life, chip formation, or surface quality.
The high machining efficiency of brass leads to reduced per-part costs, quicker return on investment (ROI) for new machine tools, and expanded production capacity for new projects.
Supply Security Through Closed Loop Recycling
Brass, like its parent element copper, can be infinitely recycled.
In 2022, brass- and wire-rod mills accounted for the majority of the 830,000 tonnes of copper recycled from scrap in the U.S.
Given that scrap ratios for machined parts typically range from 60-70% by weight, producing mills benefit from a secure and steady supply of clean scrap returned directly from customers, which is recycled to create new brass rods.
The high residual value of brass scrap creates a strong recycling incentive. Scrap buy back programs give manufacturers greater control over raw material net costs as scrap value is often factored into supplier purchase agreements.
Next Generation Alloys for a Lead-Free Future
Increasingly stringent global regulations continue to pressure manufacturers to minimize the use of materials containing trace amounts of lead and other harmful impurities.
The latest generation of brass-rod alloys is engineered to meet the most demanding criteria for lead leaching in drinking water and other sensitive applications.
Seven brass-rod alloys passed rigorous testing to become the only ‘Acceptable Materials’ against lower lead leaching criteria recently adopted in the national U.S. drinking water quality standard, NSF 61.
Learn more about the advantages of brass rods solutions.
Misc
Brass Rods: The Safe Choice
From airbags to firefighting equipment, components made from brass rods play a vital role in creating a safer environment.

Brass Rods: The Safe Choice
From airbags to firefighting equipment, components made from brass rods play a vital role in creating a safer environment.
This infographic from the Copper Development Association illustrates three use cases for brass. This is the first of three infographics in our Choose Brass series.
Why Brass?
Brass is one of the most reliable metals for industrial and other applications. It contains little to no iron, protecting it from oxidation, which can cause other materials to fail over time.
Additionally, the malleability of brass ensures tight and leak-free metal-to-metal seals for threaded joints, minimizing the risk of costly and dangerous system failures. Brass’s durability ensures critical system components function properly for years.
Brass for Safe Water Systems
Exposure to lead in water can cause various health problems, including neurological damage, developmental delays, and cardiovascular diseases.
As a result, the U.S. sets minimum health-effect requirements for chemical contaminants and impurities indirectly transferred to drinking water from products, components, and materials used in water systems.
Currently, only brass rod alloys are designated as “acceptable materials” according to national standards.
Brass is also essential for ensuring workplace safety, particularly in high-risk manufacturing environments.
Using Brass for Safe Manufacturing and Industrial Environments
Brass is used extensively in industrial applications such as machinery components, valves, fittings, architectural elements, bearings, and gears.
The machinability of brass rods also means longer tool life and higher productivity for manufacturers of precision parts.
The microstructure of brass helps break up metal chips generated during machining operations, preventing long and stringy chips that can crash machines and seriously injure operators.
Additionally, brass’s non-sparking properties make it ideal for tooling, fittings, and components in high-risk industries such as oil & gas, chemicals, pharmaceuticals, paint manufacturing, power plants, and explosives.
Brass for Safer Communities
Many pieces of equipment in our daily lives also rely on brass rod parts to function. Control valves in gas stoves, BBQs, and home furnaces made from brass rods reduce the risk of deadly gas leaks and fires.
Moreover, brass is ideal for firefighting equipment due to its corrosion resistance, durability, heat resistance, and non-sparking properties.
Fittings made from brass rods ensure that the brakes and airbags in our vehicles work when needed.
Brass and other copper-based alloys are also naturally antimicrobial, helping prevent diseases when used in high-touch surfaces such as door handles.
These are only some of the ways that brass rods help build a safer world for everyone.
Explore the Advantages of Brass Rod Solutions.

-

 Electrification3 years ago
Ranked: The Top 10 EV Battery Manufacturers
-

 Electrification2 years ago
The Key Minerals in an EV Battery
-

 Real Assets3 years ago
The World’s Top 10 Gold Mining Companies
-

 Misc3 years ago
All the Metals We Mined in One Visualization
-

 Electrification3 years ago
The Biggest Mining Companies in the World in 2021
-

 Energy Shift2 years ago
What Are the Five Major Types of Renewable Energy?
-

 Electrification2 years ago
Mapped: Solar Power by Country in 2021
-

 Electrification2 years ago
The World’s Largest Nickel Mining Companies