

Energy Shift
The Raw Material Needs of Energy Technologies
The Raw Materials in Energy Technologies
Behind every energy technology are the raw materials that power it, support it, or help build it.
From the lithium in batteries to the copper cabling in offshore wind farms, every energy technology harnesses the properties of one or the other mineral. And the world is shifting towards clean energy technologies, which are more mineral-intensive than their fossil-fuel counterparts.
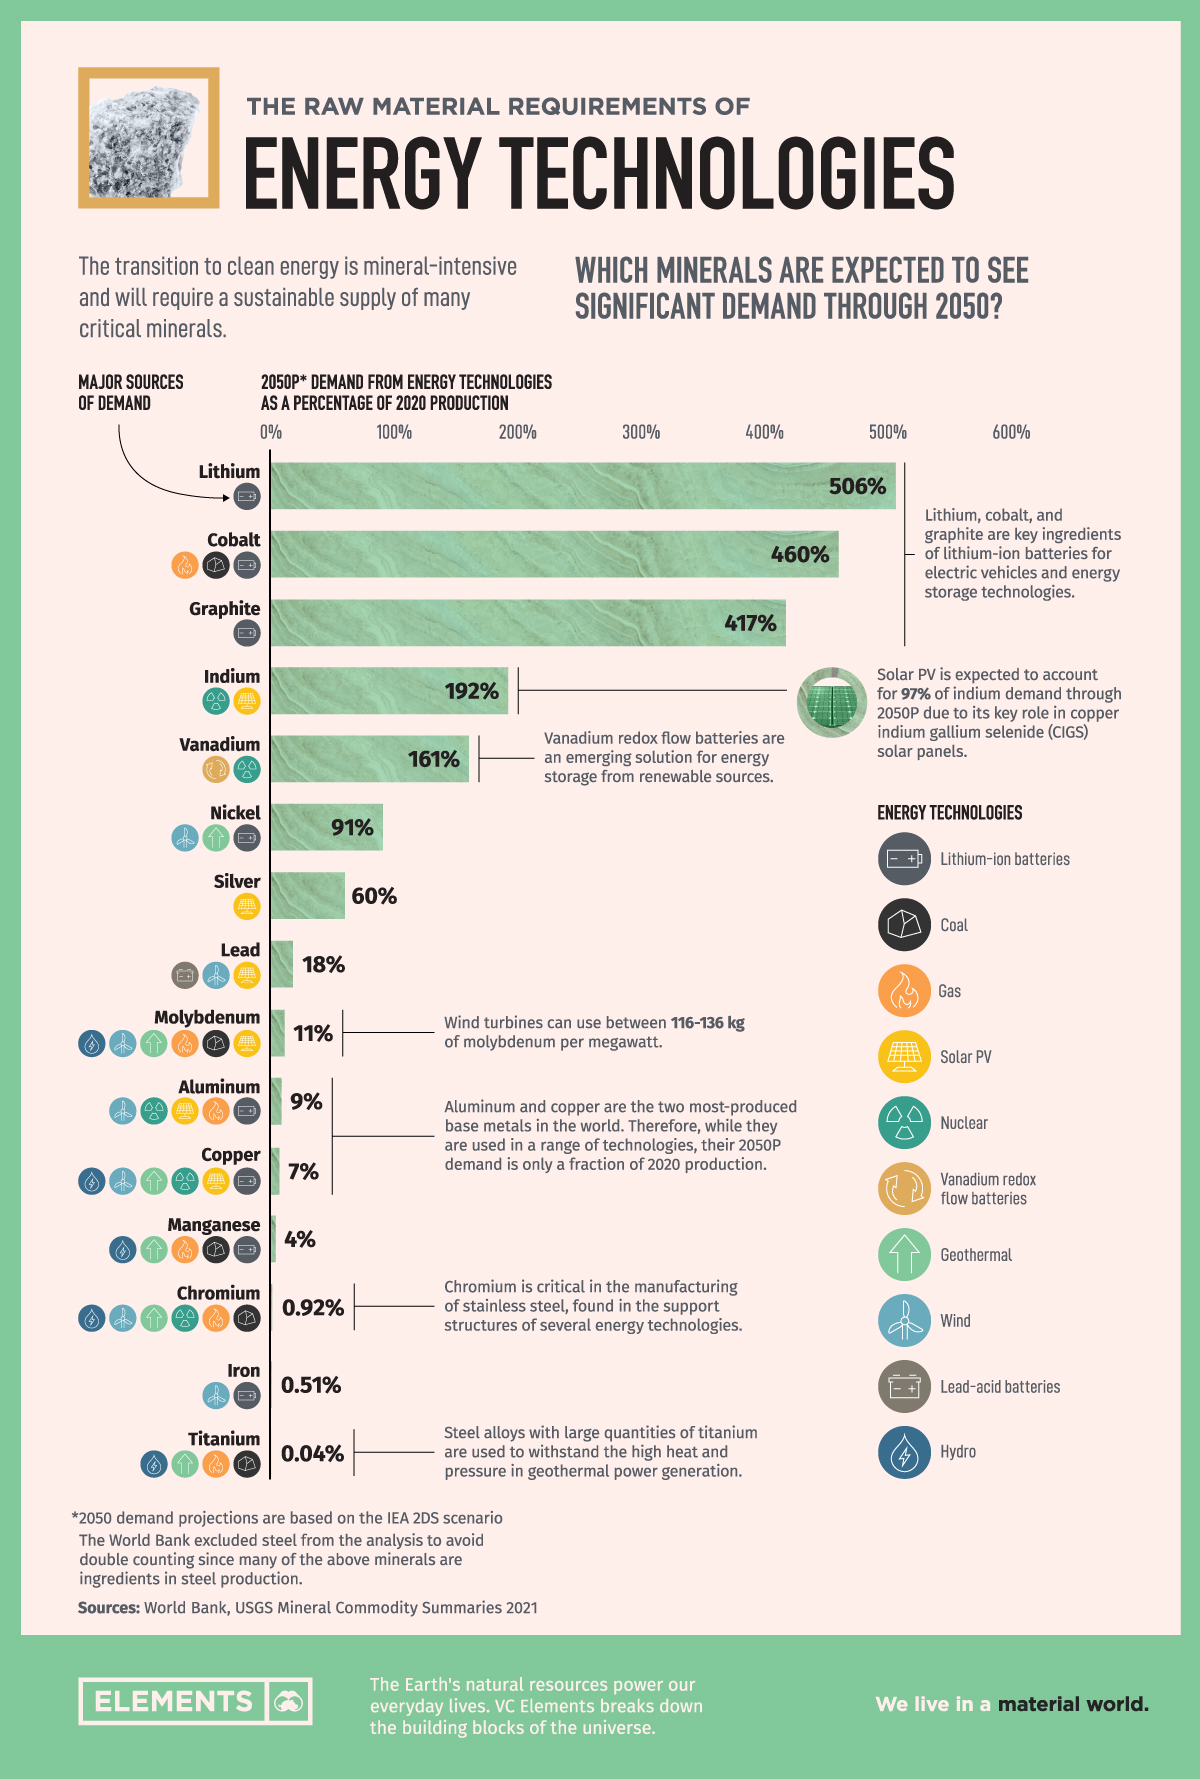
The above infographic uses data from the World Bank’s Climate Action report and charts the 2050 demand for 15 minerals from energy technologies, as a percentage of 2020 production.
Material Demand from Energy Technologies
Energy sources make use of various minerals that offer different properties and functionalities.
For instance, geothermal power plants use steel alloys with large quantities of titanium to withstand high heat and pressure. Similarly, solar panels use silver for its high conductivity, and hydropower plants use steel alloys with chromium, which hardens steel and makes it corrosion-resistant.
The demand for these energy technologies and minerals will grow alongside our energy needs. Here are some of the minerals that are expected to see increasing demand from energy technologies through 2050, relative to current production levels:
| Mineral | 2020 Production (thousand tonnes) | 2050 Annual Projected Demand (thousand tonnes) | 2050 Demand as a % of 2020 Production |
|---|---|---|---|
| Lithium | 82 | 415 | 506% |
| Cobalt | 140 | 644 | 460% |
| Graphite | 1,100 | 4,590 | 417% |
| Indium | 0.9 | 1.73 | 192% |
| Vanadium | 86 | 138 | 161% |
| Nickel | 2,500 | 2,268 | 91% |
| Silver | 25 | 15 | 60% |
| Lead | 4,400 | 781 | 18% |
| Molybdenum | 300 | 33 | 11% |
| Copper | 20,000 | 1,378 | 7% |
| Aluminum | 65,200 | 5,583 | 9% |
| Manganese | 18,500 | 694 | 4% |
| Chromium | 40,000 | 366 | 0.92% |
| Iron | 1,500,000 | 7,584 | 0.51% |
| Titanium | 8,200 | 3.44 | 0.04% |
Lithium, cobalt, and graphite—the key ingredients of EV batteries—will see the largest increases in demand, each requiring more than a 400% increase relative to 2020 production. These figures can look even more substantial once we bear in mind that this demand is only from energy technologies, and these minerals have other uses too.
Indium and vanadium may be among the lesser-known minerals in this list, however, they are important. Indium demand is expected to rise to 1,730 tonnes by 2050—largely because of demand from solar energy. Similarly, vanadium may also see a large spike in demand due to the growing need for energy storage technologies.
On the other end of the spectrum, iron and aluminum have the largest demand figures in absolute terms. However, miners already produce large quantities of these minerals, and their demand in 2050 represents less than 10% of current production levels.
The Supply and Demand Equation
Although some metals are available in abundance within the Earth’s crust, their demand and supply don’t always match up.
For example, falling copper ore grades in Chile are raising concerns over copper’s long-term supply and Citigroup projects a 521,000-tonne copper shortage for 2021. In addition, a large portion of lithium, cobalt, and graphite production occurs in a few regions, putting the battery supply chain at risk of disruptions.
While supply may be in uncertain territory, it’s extremely likely that demand will rise. As the world transitions to clean energy, a sustainable supply of these minerals could be key to meeting the raw material needs of energy technologies.


Energy Shift
The World’s Biggest Oil Producers in 2023
Just three countries accounted for 40% of global oil production last year.

The World’s Biggest Oil Producers in 2023
This was originally posted on our Voronoi app. Download the app for free on iOS or Android and discover incredible data-driven charts from a variety of trusted sources.
Despite efforts to decarbonize the global economy, oil still remains one of the world’s most important resources. It’s also produced by a fairly limited group of countries, which can be a source of economic and political leverage.
This graphic illustrates global crude oil production in 2023, measured in million barrels per day, sourced from the U.S. Energy Information Administration (EIA).
Three Countries Account for 40% of Global Oil Production
In 2023, the United States, Russia, and Saudi Arabia collectively contributed 32.7 million barrels per day to global oil production.
| Oil Production 2023 | Million barrels per day |
|---|---|
| 🇺🇸 U.S. | 12.9 |
| 🇷🇺 Russia | 10.1 |
| 🇸🇦 Saudi Arabia | 9.7 |
| 🇨🇦 Canada | 4.6 |
| 🇮🇶 Iraq | 4.3 |
| 🇨🇳 China | 4.2 |
| 🇮🇷 Iran | 3.6 |
| 🇧🇷 Brazil | 3.4 |
| 🇦🇪 UAE | 3.4 |
| 🇰🇼 Kuwait | 2.7 |
| 🌍 Other | 22.8 |
These three nations have consistently dominated oil production since 1971. The leading position, however, has alternated among them over the past five decades.
In contrast, the combined production of the next three largest producers—Canada, Iraq, and China—reached 13.1 million barrels per day in 2023, just surpassing the production of the United States alone.
In the near term, no country is likely to surpass the record production achieved by the U.S. in 2023, as no other producer has ever reached a daily capacity of 13.0 million barrels. Recently, Saudi Arabia’s state-owned Saudi Aramco scrapped plans to increase production capacity to 13.0 million barrels per day by 2027.
In 2024, analysts forecast that the U.S. will maintain its position as the top oil producer. In fact, according to Macquarie Group, U.S. oil production is expected to achieve a record pace of about 14 million barrels per day by the end of the year.
Energy Shift
How Much Does the U.S. Depend on Russian Uranium?
Despite a new uranium ban being discussed in Congress, the U.S. is still heavily dependent on Russian uranium.

How Much Does the U.S. Depend on Russian Uranium?
This was originally posted on our Voronoi app. Download the app for free on iOS or Android and discover incredible data-driven charts from a variety of trusted sources.
The U.S. House of Representatives recently passed a ban on imports of Russian uranium. The bill must pass the Senate before becoming law.
In this graphic, we visualize how much the U.S. relies on Russian uranium, based on data from the United States Energy Information Administration (EIA).
U.S. Suppliers of Enriched Uranium
After Russia invaded Ukraine, the U.S. imposed sanctions on Russian-produced oil and gas—yet Russian-enriched uranium is still being imported.
Currently, Russia is the largest foreign supplier of nuclear power fuel to the United States. In 2022, Russia supplied almost a quarter of the enriched uranium used to fuel America’s fleet of more than 90 commercial reactors.
| Country of enrichment service | SWU* | % |
|---|---|---|
| 🇺🇸 United States | 3,876 | 27.34% |
| 🇷🇺 Russia | 3,409 | 24.04% |
| 🇩🇪 Germany | 1,763 | 12.40% |
| 🇬🇧 United Kingdom | 1,593 | 11.23% |
| 🇳🇱 Netherlands | 1,303 | 9.20% |
| Other | 2,232 | 15.79% |
| Total | 14,176 | 100% |
SWU stands for “Separative Work Unit” in the uranium industry. It is a measure of the amount of work required to separate isotopes of uranium during the enrichment process. Source: U.S. Energy Information Administration
Most of the remaining uranium is imported from European countries, while another portion is produced by a British-Dutch-German consortium operating in the United States called Urenco.
Similarly, nearly a dozen countries around the world depend on Russia for more than half of their enriched uranium—and many of them are NATO-allied members and allies of Ukraine.
In 2023 alone, the U.S. nuclear industry paid over $800 million to Russia’s state-owned nuclear energy corporation, Rosatom, and its fuel subsidiaries.
It is important to note that 19% of electricity in the U.S. is powered by nuclear plants.
The dependency on Russian fuels dates back to the 1990s when the United States turned away from its own enrichment capabilities in favor of using down-blended stocks of Soviet-era weapons-grade uranium.
As part of the new uranium-ban bill, the Biden administration plans to allocate $2.2 billion for the expansion of uranium enrichment facilities in the United States.

-

 Electrification3 years ago
Ranked: The Top 10 EV Battery Manufacturers
-

 Electrification2 years ago
The Key Minerals in an EV Battery
-

 Real Assets3 years ago
The World’s Top 10 Gold Mining Companies
-

 Misc3 years ago
All the Metals We Mined in One Visualization
-

 Electrification3 years ago
The Biggest Mining Companies in the World in 2021
-

 Energy Shift2 years ago
What Are the Five Major Types of Renewable Energy?
-

 Electrification2 years ago
Mapped: Solar Power by Country in 2021
-

 Electrification2 years ago
The World’s Largest Nickel Mining Companies