

Electrification
Visualizing the Natural Graphite Supply Problem
The following content is sponsored by Northern Graphite.
Visualizing the Natural Graphite Supply Problem
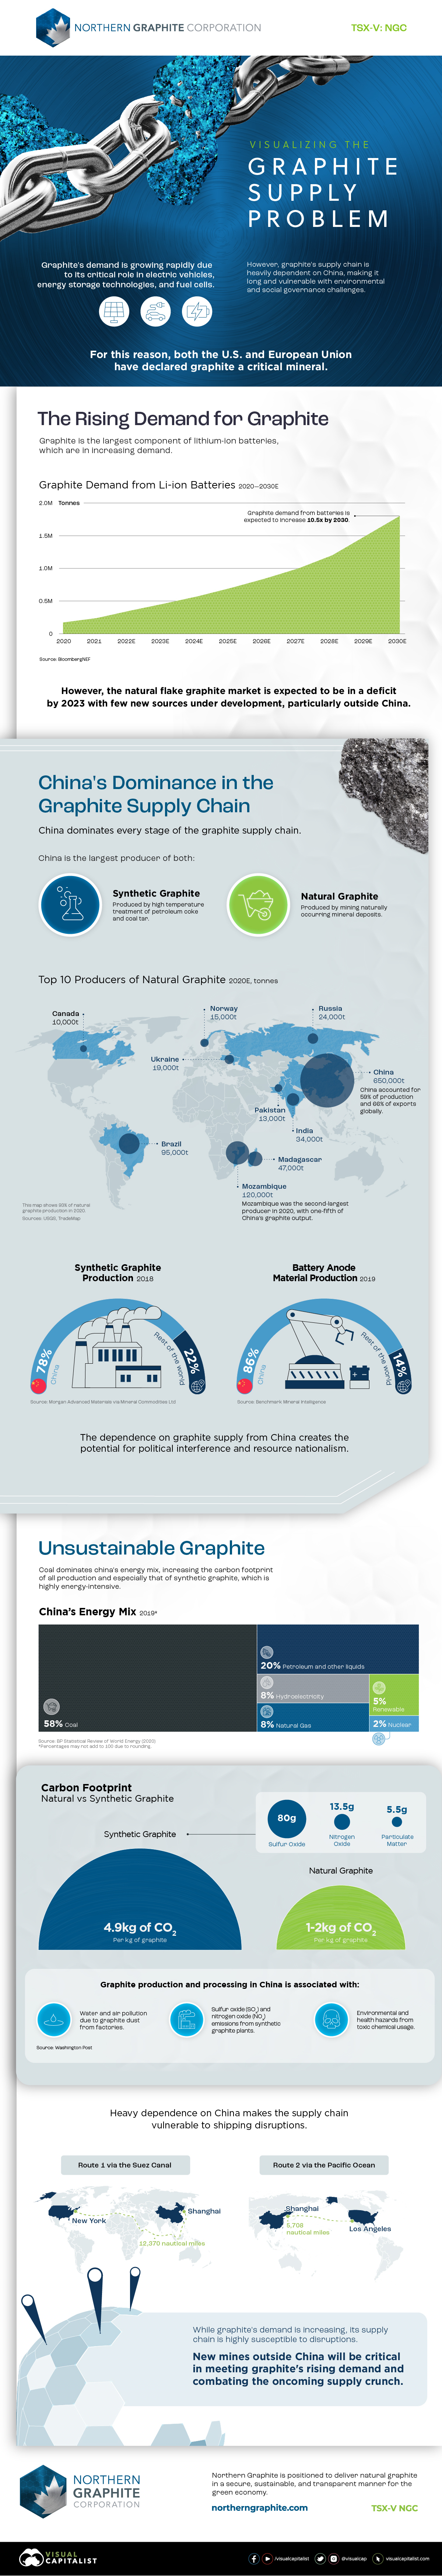
Graphite is a critical mineral for lithium-ion batteries, and its battery demand is expected to grow ten-fold by 2030.
Meeting this increasing demand will require a higher supply of both natural graphite and its synthetic counterpart. However, graphite’s entire supply chain is heavily reliant on China, which makes it vulnerable to disruptions while creating environmental challenges.
This infographic from our sponsor Northern Graphite highlights China’s stronghold over the graphite supply chain and outlines the need for new natural graphite mines.
China’s Dominance in the Graphite Supply Chain
From mining natural graphite to manufacturing battery anodes, China dominates every stage of the graphite supply chain.
For example, in 2020, 59% of global natural graphite production came from China. Mozambique, the second-largest producer, churned out 120,000 tonnes—just one-fifth of Chinese production.
| Country | 2020E production, tonnes | % of total |
|---|---|---|
| China 🇨🇳 | 650,000 | 59.1% |
| Mozambique 🇲🇿 | 120,000 | 10.9% |
| Brazil 🇧🇷 | 95,000 | 8.6% |
| Madagascar 🇲🇬 | 47,000 | 4.3% |
| India 🇮🇳 | 34,000 | 3.1% |
| Russia 🇷🇺 | 24,000 | 2.2% |
| Ukraine 🇺🇦 | 19,000 | 1.7% |
| Norway 🇳🇴 | 15,000 | 1.4% |
| Pakistan 🇵🇰 | 13,000 | 1.2% |
| Canada 🇨🇦 | 10,000 | 0.9% |
| Rest of the World 🌎 | 73,000 | 6.6% |
| Total | 1,100,000 | 100% |
China’s massive output makes the other top nine countries look substantially smaller in terms of natural graphite production. Moreover, China also dominates the manufacturing of synthetic graphite and the conversion of graphite into anode material for batteries.
In 2018, China produced nearly 80% of all synthetic graphite, and in 2019, it was responsible for 86% of all battery anode material production. This dependence on graphite supply from China puts the supply chain at risk of political disruptions and makes it unsustainable for the long term.
Unsustainable Production: Natural Graphite vs Synthetic Graphite
The carbon footprint of manufacturing partly depends on the source of energy used in production.
Coal dominates China’s energy mix with a 58% share, followed by petroleum and other liquids. This increases the carbon footprint of all production and especially that of synthetic graphite, which involves energy-intensive heat treatment of petroleum coke.
| Energy source | Type | % of China's energy consumption (2019) |
|---|---|---|
| Coal | Fossil fuel | 58% |
| Petroleum and other liquids | Fossil fuel | 20% |
| Hydro | Renewable | 8% |
| Natural gas | Fossil fuel | 8% |
| Other renewables | Renewable | 5% |
| Nuclear | Non-renewable | 2% |
| Total | N/A | 100% |
Percentages may not add to 100% due to rounding.
One study found that producing one kg of synthetic graphite releases 4.9kg of carbon dioxide into the atmosphere, in addition to smaller amounts of sulfur oxide, nitrogen oxide, and particulate matter. While the carbon footprint of natural graphite is substantially smaller, it’s likely that China’s dependence on coal contributes to emissions from production.
Furthermore, concentrated production in China means that all this graphite travels long distances before reaching Western markets like the United States. These extensive shipping distances further exacerbate the risk of disruptions in the graphite supply chain.
The Need for New Sources
As the demand for graphite increases, developing a resilient graphite supply chain is crucial to the European Union and the U.S., both of which have declared graphite a critical mineral.
New graphite mines outside China will be key to meeting graphite’s rising demand and combating a potential supply deficit.
Northern Graphite is positioned to deliver natural graphite in a secure, sustainable, and transparent manner for the green economy.


Electrification
Ranked: The Top 10 EV Battery Manufacturers in 2023
Asia dominates this ranking of the world’s largest EV battery manufacturers in 2023.

The Top 10 EV Battery Manufacturers in 2023
This was originally posted on our Voronoi app. Download the app for free on iOS or Android and discover incredible data-driven charts from a variety of trusted sources.
Despite efforts from the U.S. and EU to secure local domestic supply, all major EV battery manufacturers remain based in Asia.
In this graphic we rank the top 10 EV battery manufacturers by total battery deployment (measured in megawatt-hours) in 2023. The data is from EV Volumes.
Chinese Dominance
Contemporary Amperex Technology Co. Limited (CATL) has swiftly risen in less than a decade to claim the title of the largest global battery group.
The Chinese company now has a 34% share of the market and supplies batteries to a range of made-in-China vehicles, including the Tesla Model Y, SAIC’s MG4/Mulan, and Li Auto models.
| Company | Country | 2023 Production (megawatt-hour) | Share of Total Production |
|---|---|---|---|
| CATL | 🇨🇳China | 242,700 | 34% |
| BYD | 🇨🇳China | 115,917 | 16% |
| LG Energy Solution | 🇰🇷Korea | 108,487 | 15% |
| Panasonic | 🇯🇵Japan | 56,560 | 8% |
| SK On | 🇰🇷Korea | 40,711 | 6% |
| Samsung SDI | 🇰🇷Korea | 35,703 | 5% |
| CALB | 🇨🇳China | 23,493 | 3% |
| Farasis Energy | 🇨🇳China | 16,527 | 2% |
| Envision AESC | 🇨🇳China | 8,342 | 1% |
| Sunwoda | 🇨🇳China | 6,979 | 1% |
| Other | - | 56,040 | 8% |
In 2023, BYD surpassed LG Energy Solution to claim second place. This was driven by demand from its own models and growth in third-party deals, including providing batteries for the made-in-Germany Tesla Model Y, Toyota bZ3, Changan UNI-V, Venucia V-Online, as well as several Haval and FAW models.
The top three battery makers (CATL, BYD, LG) collectively account for two-thirds (66%) of total battery deployment.
Once a leader in the EV battery business, Panasonic now holds the fourth position with an 8% market share, down from 9% last year. With its main client, Tesla, now effectively sourcing batteries from multiple suppliers, the Japanese battery maker seems to be losing its competitive edge in the industry.
Overall, the global EV battery market size is projected to grow from $49 billion in 2022 to $98 billion by 2029, according to Fortune Business Insights.
Electrification
White Gold: Mapping U.S. Lithium Mines
In this graphic, Visual Capitalist partnerered with EnergyX to explore the size and location of U.S. lithium mines.

White Gold: Mapping U.S. Lithium Mines
The U.S. doubled imports of lithium-ion batteries for the third consecutive year in 2022, and with EV demand growing yearly, U.S. lithium mines must ramp up production or rely on other nations for their supply of refined lithium.
To determine if the domestic U.S. lithium opportunity can meet demand, we partnered with EnergyX to determine how much lithium sits within U.S. borders.
U.S. Lithium Projects
The most crucial measure of a lithium mine’s potential is the quantity that can be extracted from the source.
For each lithium resource, the potential volume of lithium carbonate equivalent (LCE) was calculated with a ratio of one metric ton of lithium producing 5.32 metric tons of LCE. Cumulatively, existing U.S. lithium projects contain 94.8 million metric tons of LCE.
| Rank | Project Name | LCE, million metric tons (est.) |
|---|---|---|
| 1 | McDermitt Caldera | 21.5 |
| 2 | Thacker Pass | 19.1 |
| 3 | Tonopah Flats | 18.0 |
| 4 | TLC Lithium | 10.7 |
| 5 | Clayton Valley (Century Lithium) | 6.3 |
| 6 | Zeus Lithium | 6.3 |
| 7 | Rhyolite Ridge | 3.4 |
| 8 | Arkansas Smackover (Phase 1A) | 2.8 |
| 9 | Basin Project | 2.2 |
| 10 | McGee Deposit | 2.1 |
| 11 | Arkansas Smackover (South West) | 1.8 |
| 12 | Clayton Valley (Lithium-X, Pure Energy) | 0.8 |
| 13 | Big Sandy | 0.3 |
| 14 | Imperial Valley/Salton Sea | 0.3 |
U.S. Lithium Opportunities, By State
U.S. lithium projects mainly exist in western states, with comparatively minor opportunities in central or eastern states.
| State | LCE, million metric tons (est.) |
|---|---|
| Nevada | 88.2 |
| Arkansas | 4.6 |
| Arizona | 2.5 |
| California | 0.3 |
Currently, the U.S. is sitting on a wealth of lithium that it is underutilizing. For context, in 2022, the U.S. only produced about 5,000 metric tons of LCE and imported a projected 19,000 metric tons of LCE, showing that the demand for the mineral is healthy.
The Next Gold Rush?
U.S. lithium companies have the opportunity to become global leaders in lithium production and accelerate the transition to sustainable energy sources. This is particularly important as the demand for lithium is increasing every year.
EnergyX is on a mission to meet U.S. lithium demands using groundbreaking technology that can extract 300% more lithium from a source than traditional methods.
You can take advantage of this opportunity by investing in EnergyX and joining other significant players like GM in becoming a shareholder.


-

 Electrification3 years ago
Ranked: The Top 10 EV Battery Manufacturers
-

 Electrification2 years ago
The Key Minerals in an EV Battery
-

 Real Assets3 years ago
The World’s Top 10 Gold Mining Companies
-

 Misc3 years ago
All the Metals We Mined in One Visualization
-

 Electrification3 years ago
The Biggest Mining Companies in the World in 2021
-

 Energy Shift2 years ago
What Are the Five Major Types of Renewable Energy?
-

 Electrification2 years ago
Mapped: Solar Power by Country in 2021
-

 Electrification2 years ago
The World’s Largest Nickel Mining Companies