

Electrification
Natural Graphite: The Material for a Green Economy
The following content is sponsored by Northern Graphite.
Natural Graphite: The Material for a Green Economy
As the world moves towards decarbonization, electric vehicles (EVs) and clean energy technologies offer a path towards a sustainable future. However, these technologies are mineral-intensive, and the minerals they use are becoming increasingly valuable.
Graphite is one such mineral.
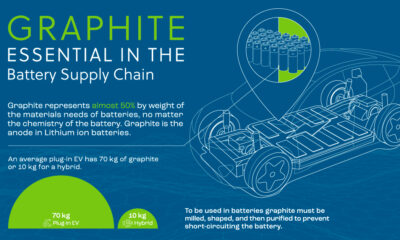
As the anode material and single largest component of lithium-ion batteries, graphite has a key role in the clean energy transition. But there are two types of graphite: natural and synthetic. Which one is better for the green economy?
The above infographic from Northern Graphite outlines the need for graphite and weighs the pros and cons of the two types of graphite.
The Need for Graphite
Graphite has six key properties that make it essential for EVs and other clean energy technologies.
- High electrical conductivity
- High thermal conductivity
- Relatively low cost
- High energy density
- Long cycle life
- High temperature resistance
A single EV contains 66.3kg of graphite, according to the IEA. With more EVs on the road, the world will need more graphite. In fact, among critical battery metals like cobalt, nickel, and lithium, graphite is projected to see the largest increase in demand through 2029.
Batteries can use both types of graphite as anode materials. As of 2020, synthetic graphite dominated the anode market with 58% of market share. However, this could change over the next decade. By 2030, natural graphite is expected to see a 1437% increase in anode demand, compared to a 705% increase for synthetic graphite.
Why is the demand for natural graphite rising at a faster rate?
Natural Graphite vs Synthetic Graphite
The methods of production make the key distinction between the two types of graphite. Natural graphite occurs naturally in mineral deposits and miners extract it from the ground through open-pit and underground mining. On the contrary, manufacturers make synthetic graphite by high-temperature treatment of carbon materials like petroleum coke and coal tar.
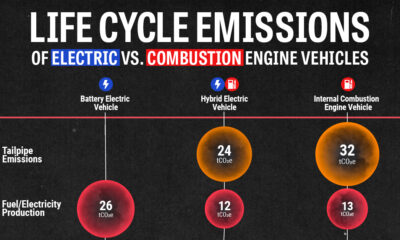
Producing graphite from mineral deposits results in carbon dioxide (CO2) emissions from the conventional mining process. However, the heat treatment of synthetic graphite is an energy-intensive process that releases harmful emissions.
According to one study, the manufacturing of synthetic graphite produces roughly 4.9kg of CO2 per kg of graphite. That’s roughly three times the amount of CO2 emissions that come from producing 1kg of natural graphite.
Additionally, natural graphite is also cheaper to produce than synthetic graphite. According to research from the Öko-Institut in Germany, anode material made from natural graphite is priced between $4 and $8 per kg, while synthetic graphite-based anode material costs $12-$13 per kg.
The Anode Material for a Green Economy
Critical minerals like graphite are becoming increasingly important in the transition to clean energy. However, managing the environmental impact and efficiency of producing these raw materials is just as important.
With a lower environmental footprint and lower production costs, natural graphite is the anode material for a greener future. As the energy transition continues, new graphite mines could play a key role in meeting graphite’s rapidly growing demand.


Electrification
Ranked: The Top 10 EV Battery Manufacturers in 2023
Asia dominates this ranking of the world’s largest EV battery manufacturers in 2023.

The Top 10 EV Battery Manufacturers in 2023
This was originally posted on our Voronoi app. Download the app for free on iOS or Android and discover incredible data-driven charts from a variety of trusted sources.
Despite efforts from the U.S. and EU to secure local domestic supply, all major EV battery manufacturers remain based in Asia.
In this graphic we rank the top 10 EV battery manufacturers by total battery deployment (measured in megawatt-hours) in 2023. The data is from EV Volumes.
Chinese Dominance
Contemporary Amperex Technology Co. Limited (CATL) has swiftly risen in less than a decade to claim the title of the largest global battery group.
The Chinese company now has a 34% share of the market and supplies batteries to a range of made-in-China vehicles, including the Tesla Model Y, SAIC’s MG4/Mulan, and Li Auto models.
| Company | Country | 2023 Production (megawatt-hour) | Share of Total Production |
|---|---|---|---|
| CATL | 🇨🇳China | 242,700 | 34% |
| BYD | 🇨🇳China | 115,917 | 16% |
| LG Energy Solution | 🇰🇷Korea | 108,487 | 15% |
| Panasonic | 🇯🇵Japan | 56,560 | 8% |
| SK On | 🇰🇷Korea | 40,711 | 6% |
| Samsung SDI | 🇰🇷Korea | 35,703 | 5% |
| CALB | 🇨🇳China | 23,493 | 3% |
| Farasis Energy | 🇨🇳China | 16,527 | 2% |
| Envision AESC | 🇨🇳China | 8,342 | 1% |
| Sunwoda | 🇨🇳China | 6,979 | 1% |
| Other | - | 56,040 | 8% |
In 2023, BYD surpassed LG Energy Solution to claim second place. This was driven by demand from its own models and growth in third-party deals, including providing batteries for the made-in-Germany Tesla Model Y, Toyota bZ3, Changan UNI-V, Venucia V-Online, as well as several Haval and FAW models.
The top three battery makers (CATL, BYD, LG) collectively account for two-thirds (66%) of total battery deployment.
Once a leader in the EV battery business, Panasonic now holds the fourth position with an 8% market share, down from 9% last year. With its main client, Tesla, now effectively sourcing batteries from multiple suppliers, the Japanese battery maker seems to be losing its competitive edge in the industry.
Overall, the global EV battery market size is projected to grow from $49 billion in 2022 to $98 billion by 2029, according to Fortune Business Insights.
Electrification
White Gold: Mapping U.S. Lithium Mines
In this graphic, Visual Capitalist partnerered with EnergyX to explore the size and location of U.S. lithium mines.

White Gold: Mapping U.S. Lithium Mines
The U.S. doubled imports of lithium-ion batteries for the third consecutive year in 2022, and with EV demand growing yearly, U.S. lithium mines must ramp up production or rely on other nations for their supply of refined lithium.
To determine if the domestic U.S. lithium opportunity can meet demand, we partnered with EnergyX to determine how much lithium sits within U.S. borders.
U.S. Lithium Projects
The most crucial measure of a lithium mine’s potential is the quantity that can be extracted from the source.
For each lithium resource, the potential volume of lithium carbonate equivalent (LCE) was calculated with a ratio of one metric ton of lithium producing 5.32 metric tons of LCE. Cumulatively, existing U.S. lithium projects contain 94.8 million metric tons of LCE.
| Rank | Project Name | LCE, million metric tons (est.) |
|---|---|---|
| 1 | McDermitt Caldera | 21.5 |
| 2 | Thacker Pass | 19.1 |
| 3 | Tonopah Flats | 18.0 |
| 4 | TLC Lithium | 10.7 |
| 5 | Clayton Valley (Century Lithium) | 6.3 |
| 6 | Zeus Lithium | 6.3 |
| 7 | Rhyolite Ridge | 3.4 |
| 8 | Arkansas Smackover (Phase 1A) | 2.8 |
| 9 | Basin Project | 2.2 |
| 10 | McGee Deposit | 2.1 |
| 11 | Arkansas Smackover (South West) | 1.8 |
| 12 | Clayton Valley (Lithium-X, Pure Energy) | 0.8 |
| 13 | Big Sandy | 0.3 |
| 14 | Imperial Valley/Salton Sea | 0.3 |
U.S. Lithium Opportunities, By State
U.S. lithium projects mainly exist in western states, with comparatively minor opportunities in central or eastern states.
| State | LCE, million metric tons (est.) |
|---|---|
| Nevada | 88.2 |
| Arkansas | 4.6 |
| Arizona | 2.5 |
| California | 0.3 |
Currently, the U.S. is sitting on a wealth of lithium that it is underutilizing. For context, in 2022, the U.S. only produced about 5,000 metric tons of LCE and imported a projected 19,000 metric tons of LCE, showing that the demand for the mineral is healthy.
The Next Gold Rush?
U.S. lithium companies have the opportunity to become global leaders in lithium production and accelerate the transition to sustainable energy sources. This is particularly important as the demand for lithium is increasing every year.
EnergyX is on a mission to meet U.S. lithium demands using groundbreaking technology that can extract 300% more lithium from a source than traditional methods.
You can take advantage of this opportunity by investing in EnergyX and joining other significant players like GM in becoming a shareholder.


-

 Electrification3 years ago
Ranked: The Top 10 EV Battery Manufacturers
-

 Electrification2 years ago
The Key Minerals in an EV Battery
-

 Real Assets3 years ago
The World’s Top 10 Gold Mining Companies
-

 Misc3 years ago
All the Metals We Mined in One Visualization
-

 Electrification3 years ago
The Biggest Mining Companies in the World in 2021
-

 Energy Shift2 years ago
What Are the Five Major Types of Renewable Energy?
-

 Electrification2 years ago
Mapped: Solar Power by Country in 2021
-

 Electrification2 years ago
The World’s Largest Nickel Mining Companies