

Energy Shift
The Next Generation of Uranium Deposits
The following content is sponsored by the Skyharbour Resources
The Next Generation of Uranium Deposits
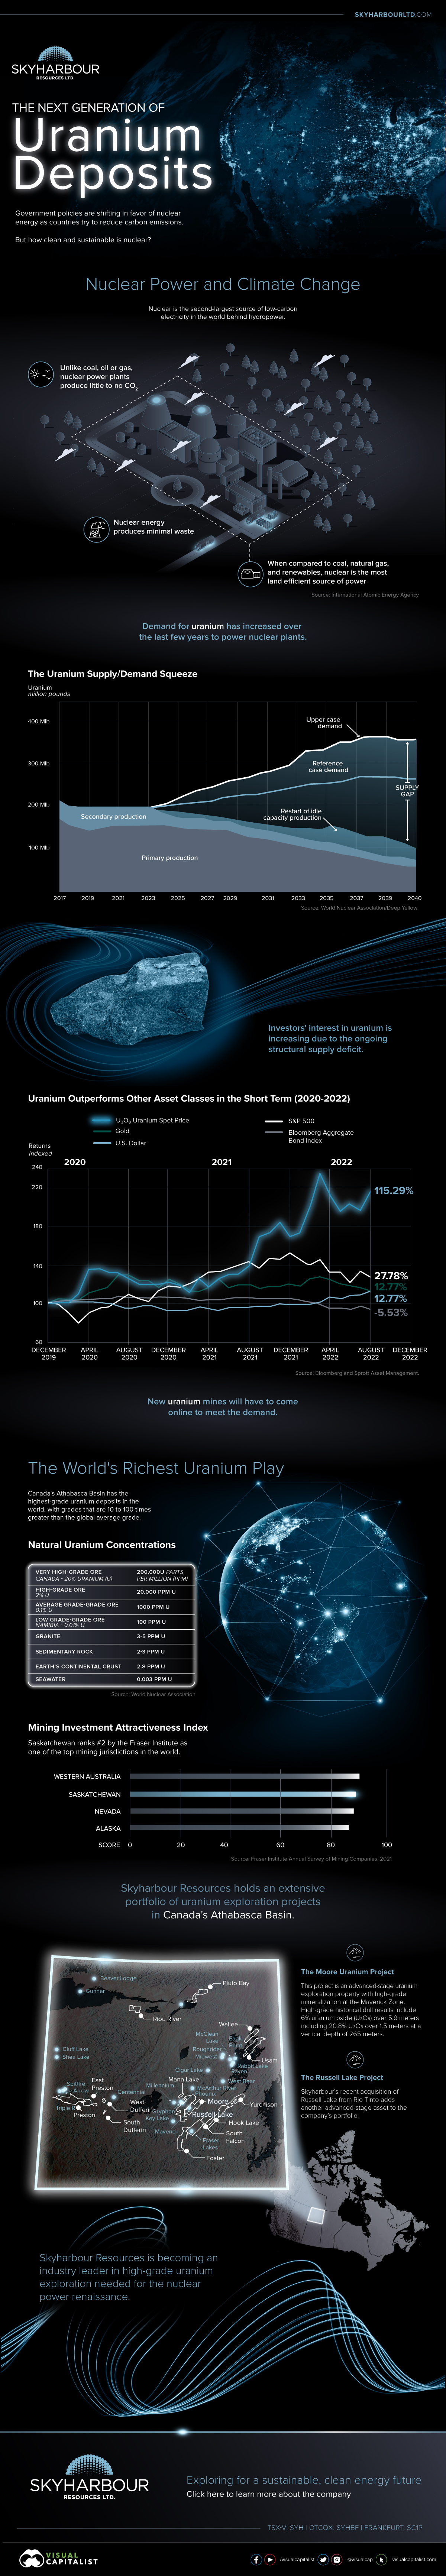
Government policies are shifting in favor of nuclear energy as countries try to reduce carbon emissions.
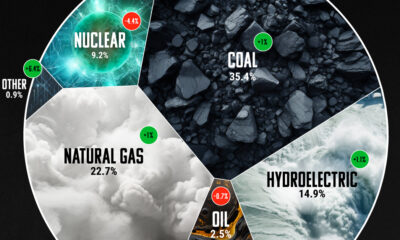
Unlike coal, oil, or gas, nuclear power plants produce little to no CO2. As a result, nuclear is the second largest source of low-carbon electricity in the world, behind hydropower.
In this infographic from Skyharbour Resources, we look closely at the next generation of uranium deposits necessary to power up the nuclear sector.
The Uranium Supply Squeeze
Roughly 440 nuclear reactors operating worldwide generate around 10% of the world’s electricity annually.
In the United States, for example, nuclear energy provides 52% of carbon-free electricity, and in the European Union, it accounts for 43%. In three European countries, the share of nuclear energy in the electricity mix exceeds 50%.
| Rank | Country | Nuclear Share of Electricity Mix |
|---|---|---|
| #1 | France 🇫🇷 | 70.6% |
| #2 | Slovakia 🇸🇰 | 53.1% |
| #3 | Ukraine 🇺🇦 | 51.2% |
| #4 | Hungary 🇭🇺 | 48.0% |
| #5 | Bulgaria 🇧🇬 | 40.8% |
| #6 | Belgium 🇧🇪 | 39.1% |
| #7 | Slovenia 🇸🇮 | 37.8% |
| #8 | Czechia 🇨🇿 | 37.3% |
| #9 | Armenia 🇦🇲 | 34.5% |
| #10 | Finland 🇫🇮 | 33.9% |
| #11 | Switzerland 🇨🇭 | 32.9% |
| #12 | Sweden 🇸🇪 | 29.8% |
| #13 | South Korea 🇰🇷 | 29.6% |
| #14 | Spain 🇪🇸 | 22.2% |
| #15 | Russia 🇷🇺 | 20.6% |
| #16 | Romania 🇷🇴 | 19.9% |
| #17 | United States 🇺🇸 | 19.7% |
| #18 | Canada 🇨🇦 | 14.6% |
| #19 | United Kingdom 🇬🇧 | 14.5% |
| #20 | Germany 🇩🇪 | 11.3% |
All of the world’s nuclear reactors are powered by uranium. They require approximately 67,500 tonnes of uranium annually. However, the uranium market has been in a growing deficit since 2015, with the widening demand-supply gap being filled by civil stockpiles and secondary sources.
The World Nuclear Association expects a 27% increase in demand between 2021 and 2030.
In addition, the recent energy crisis following Russia’s invasion of Ukraine has led investors to the uranium market, betting on nuclear energy to shift away from fossil fuels. In this scenario, new uranium mines are expected to come online in the next decade to meet the demand.
The World’s Richest Uranium Region
Canada is the world’s second-largest producer of uranium, accounting for roughly 13% of total global output.
The country’s Athabasca Basin has the highest-grade uranium deposits in the world, with grades that are 10 to 100 times greater than the global average. The Northern area covers almost a quarter of Saskatchewan and a small portion of Alberta.
The region— sometimes described as the “Persian Gulf of uranium” — is home to Cameco’s Cigar Lake, the world’s richest uranium mine.
According to the Fraser Institute, Saskatchewan ranks #2 as one of the top mining jurisdictions in the world. The province appears only behind Western Australia regarding geologic attractiveness, government policy, and attitudes toward exploration investment.
In recent years, many uranium companies have made uranium discoveries in the basin, with Skyharbour Resources among them. The company holds an extensive portfolio of fifteen uranium exploration projects, ten of which are drill-ready, covering 450,000 hectares of mineral claims.
The U.S. Nuclear Future
While the Biden administration is urging lawmakers to pass a $4.3 billion plan to purchase enriched uranium from domestic producers, the country’s production is still considered small in scale.
For this reason, Athabasca Basin and companies like Skyharbour Resources are expected to play a key role in the U.S.’ nuclear future.
Skyharbour Resources is becoming an industry leader in high-grade Canadian uranium exploration needed for nuclear power and clean energy.


Energy Shift
The World’s Biggest Oil Producers in 2023
Just three countries accounted for 40% of global oil production last year.

The World’s Biggest Oil Producers in 2023
This was originally posted on our Voronoi app. Download the app for free on iOS or Android and discover incredible data-driven charts from a variety of trusted sources.
Despite efforts to decarbonize the global economy, oil still remains one of the world’s most important resources. It’s also produced by a fairly limited group of countries, which can be a source of economic and political leverage.
This graphic illustrates global crude oil production in 2023, measured in million barrels per day, sourced from the U.S. Energy Information Administration (EIA).
Three Countries Account for 40% of Global Oil Production
In 2023, the United States, Russia, and Saudi Arabia collectively contributed 32.7 million barrels per day to global oil production.
| Oil Production 2023 | Million barrels per day |
|---|---|
| 🇺🇸 U.S. | 12.9 |
| 🇷🇺 Russia | 10.1 |
| 🇸🇦 Saudi Arabia | 9.7 |
| 🇨🇦 Canada | 4.6 |
| 🇮🇶 Iraq | 4.3 |
| 🇨🇳 China | 4.2 |
| 🇮🇷 Iran | 3.6 |
| 🇧🇷 Brazil | 3.4 |
| 🇦🇪 UAE | 3.4 |
| 🇰🇼 Kuwait | 2.7 |
| 🌍 Other | 22.8 |
These three nations have consistently dominated oil production since 1971. The leading position, however, has alternated among them over the past five decades.
In contrast, the combined production of the next three largest producers—Canada, Iraq, and China—reached 13.1 million barrels per day in 2023, just surpassing the production of the United States alone.
In the near term, no country is likely to surpass the record production achieved by the U.S. in 2023, as no other producer has ever reached a daily capacity of 13.0 million barrels. Recently, Saudi Arabia’s state-owned Saudi Aramco scrapped plans to increase production capacity to 13.0 million barrels per day by 2027.
In 2024, analysts forecast that the U.S. will maintain its position as the top oil producer. In fact, according to Macquarie Group, U.S. oil production is expected to achieve a record pace of about 14 million barrels per day by the end of the year.
Energy Shift
How Much Does the U.S. Depend on Russian Uranium?
Despite a new uranium ban being discussed in Congress, the U.S. is still heavily dependent on Russian uranium.

How Much Does the U.S. Depend on Russian Uranium?
This was originally posted on our Voronoi app. Download the app for free on iOS or Android and discover incredible data-driven charts from a variety of trusted sources.
The U.S. House of Representatives recently passed a ban on imports of Russian uranium. The bill must pass the Senate before becoming law.
In this graphic, we visualize how much the U.S. relies on Russian uranium, based on data from the United States Energy Information Administration (EIA).
U.S. Suppliers of Enriched Uranium
After Russia invaded Ukraine, the U.S. imposed sanctions on Russian-produced oil and gas—yet Russian-enriched uranium is still being imported.
Currently, Russia is the largest foreign supplier of nuclear power fuel to the United States. In 2022, Russia supplied almost a quarter of the enriched uranium used to fuel America’s fleet of more than 90 commercial reactors.
| Country of enrichment service | SWU* | % |
|---|---|---|
| 🇺🇸 United States | 3,876 | 27.34% |
| 🇷🇺 Russia | 3,409 | 24.04% |
| 🇩🇪 Germany | 1,763 | 12.40% |
| 🇬🇧 United Kingdom | 1,593 | 11.23% |
| 🇳🇱 Netherlands | 1,303 | 9.20% |
| Other | 2,232 | 15.79% |
| Total | 14,176 | 100% |
SWU stands for “Separative Work Unit” in the uranium industry. It is a measure of the amount of work required to separate isotopes of uranium during the enrichment process. Source: U.S. Energy Information Administration
Most of the remaining uranium is imported from European countries, while another portion is produced by a British-Dutch-German consortium operating in the United States called Urenco.
Similarly, nearly a dozen countries around the world depend on Russia for more than half of their enriched uranium—and many of them are NATO-allied members and allies of Ukraine.
In 2023 alone, the U.S. nuclear industry paid over $800 million to Russia’s state-owned nuclear energy corporation, Rosatom, and its fuel subsidiaries.
It is important to note that 19% of electricity in the U.S. is powered by nuclear plants.
The dependency on Russian fuels dates back to the 1990s when the United States turned away from its own enrichment capabilities in favor of using down-blended stocks of Soviet-era weapons-grade uranium.
As part of the new uranium-ban bill, the Biden administration plans to allocate $2.2 billion for the expansion of uranium enrichment facilities in the United States.

-

 Electrification3 years ago
Ranked: The Top 10 EV Battery Manufacturers
-

 Electrification2 years ago
The Key Minerals in an EV Battery
-

 Real Assets3 years ago
The World’s Top 10 Gold Mining Companies
-

 Misc3 years ago
All the Metals We Mined in One Visualization
-

 Electrification3 years ago
The Biggest Mining Companies in the World in 2021
-

 Energy Shift2 years ago
What Are the Five Major Types of Renewable Energy?
-

 Electrification2 years ago
Mapped: Solar Power by Country in 2021
-

 Electrification2 years ago
The World’s Largest Nickel Mining Companies