

Energy Shift
Visualizing Changes in CO₂ Emissions Since 1900
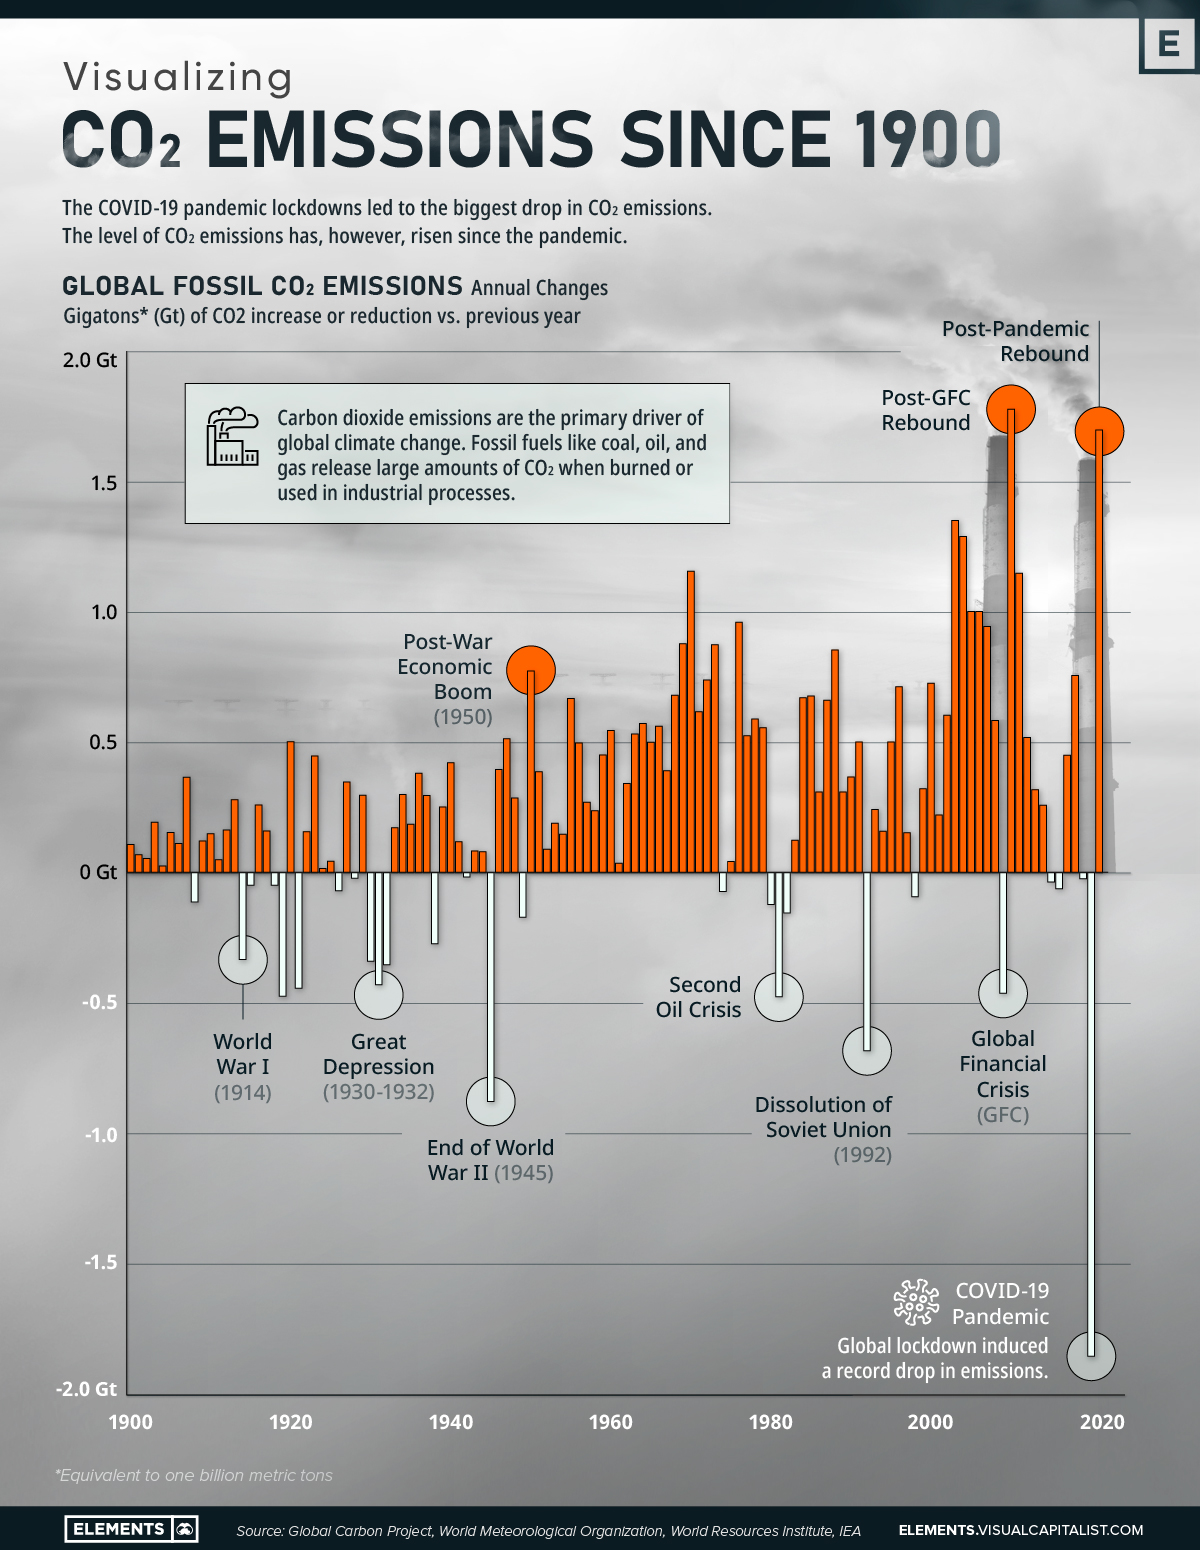


Visualizing CO₂ Emissions Since 1900
Leaders from all over the world are currently gathering at the Conference of the Parties of the UNFCCC (COP 27) in Egypt to discuss climate action, and to negotiate the commitments being made by countries to the global climate agenda.
This visualization based on data from the Global Carbon Project shows the changes in global fossil fuel carbon dioxide (CO₂) emissions from 1900 to 2020, putting the challenge of fighting climate change into perspective.
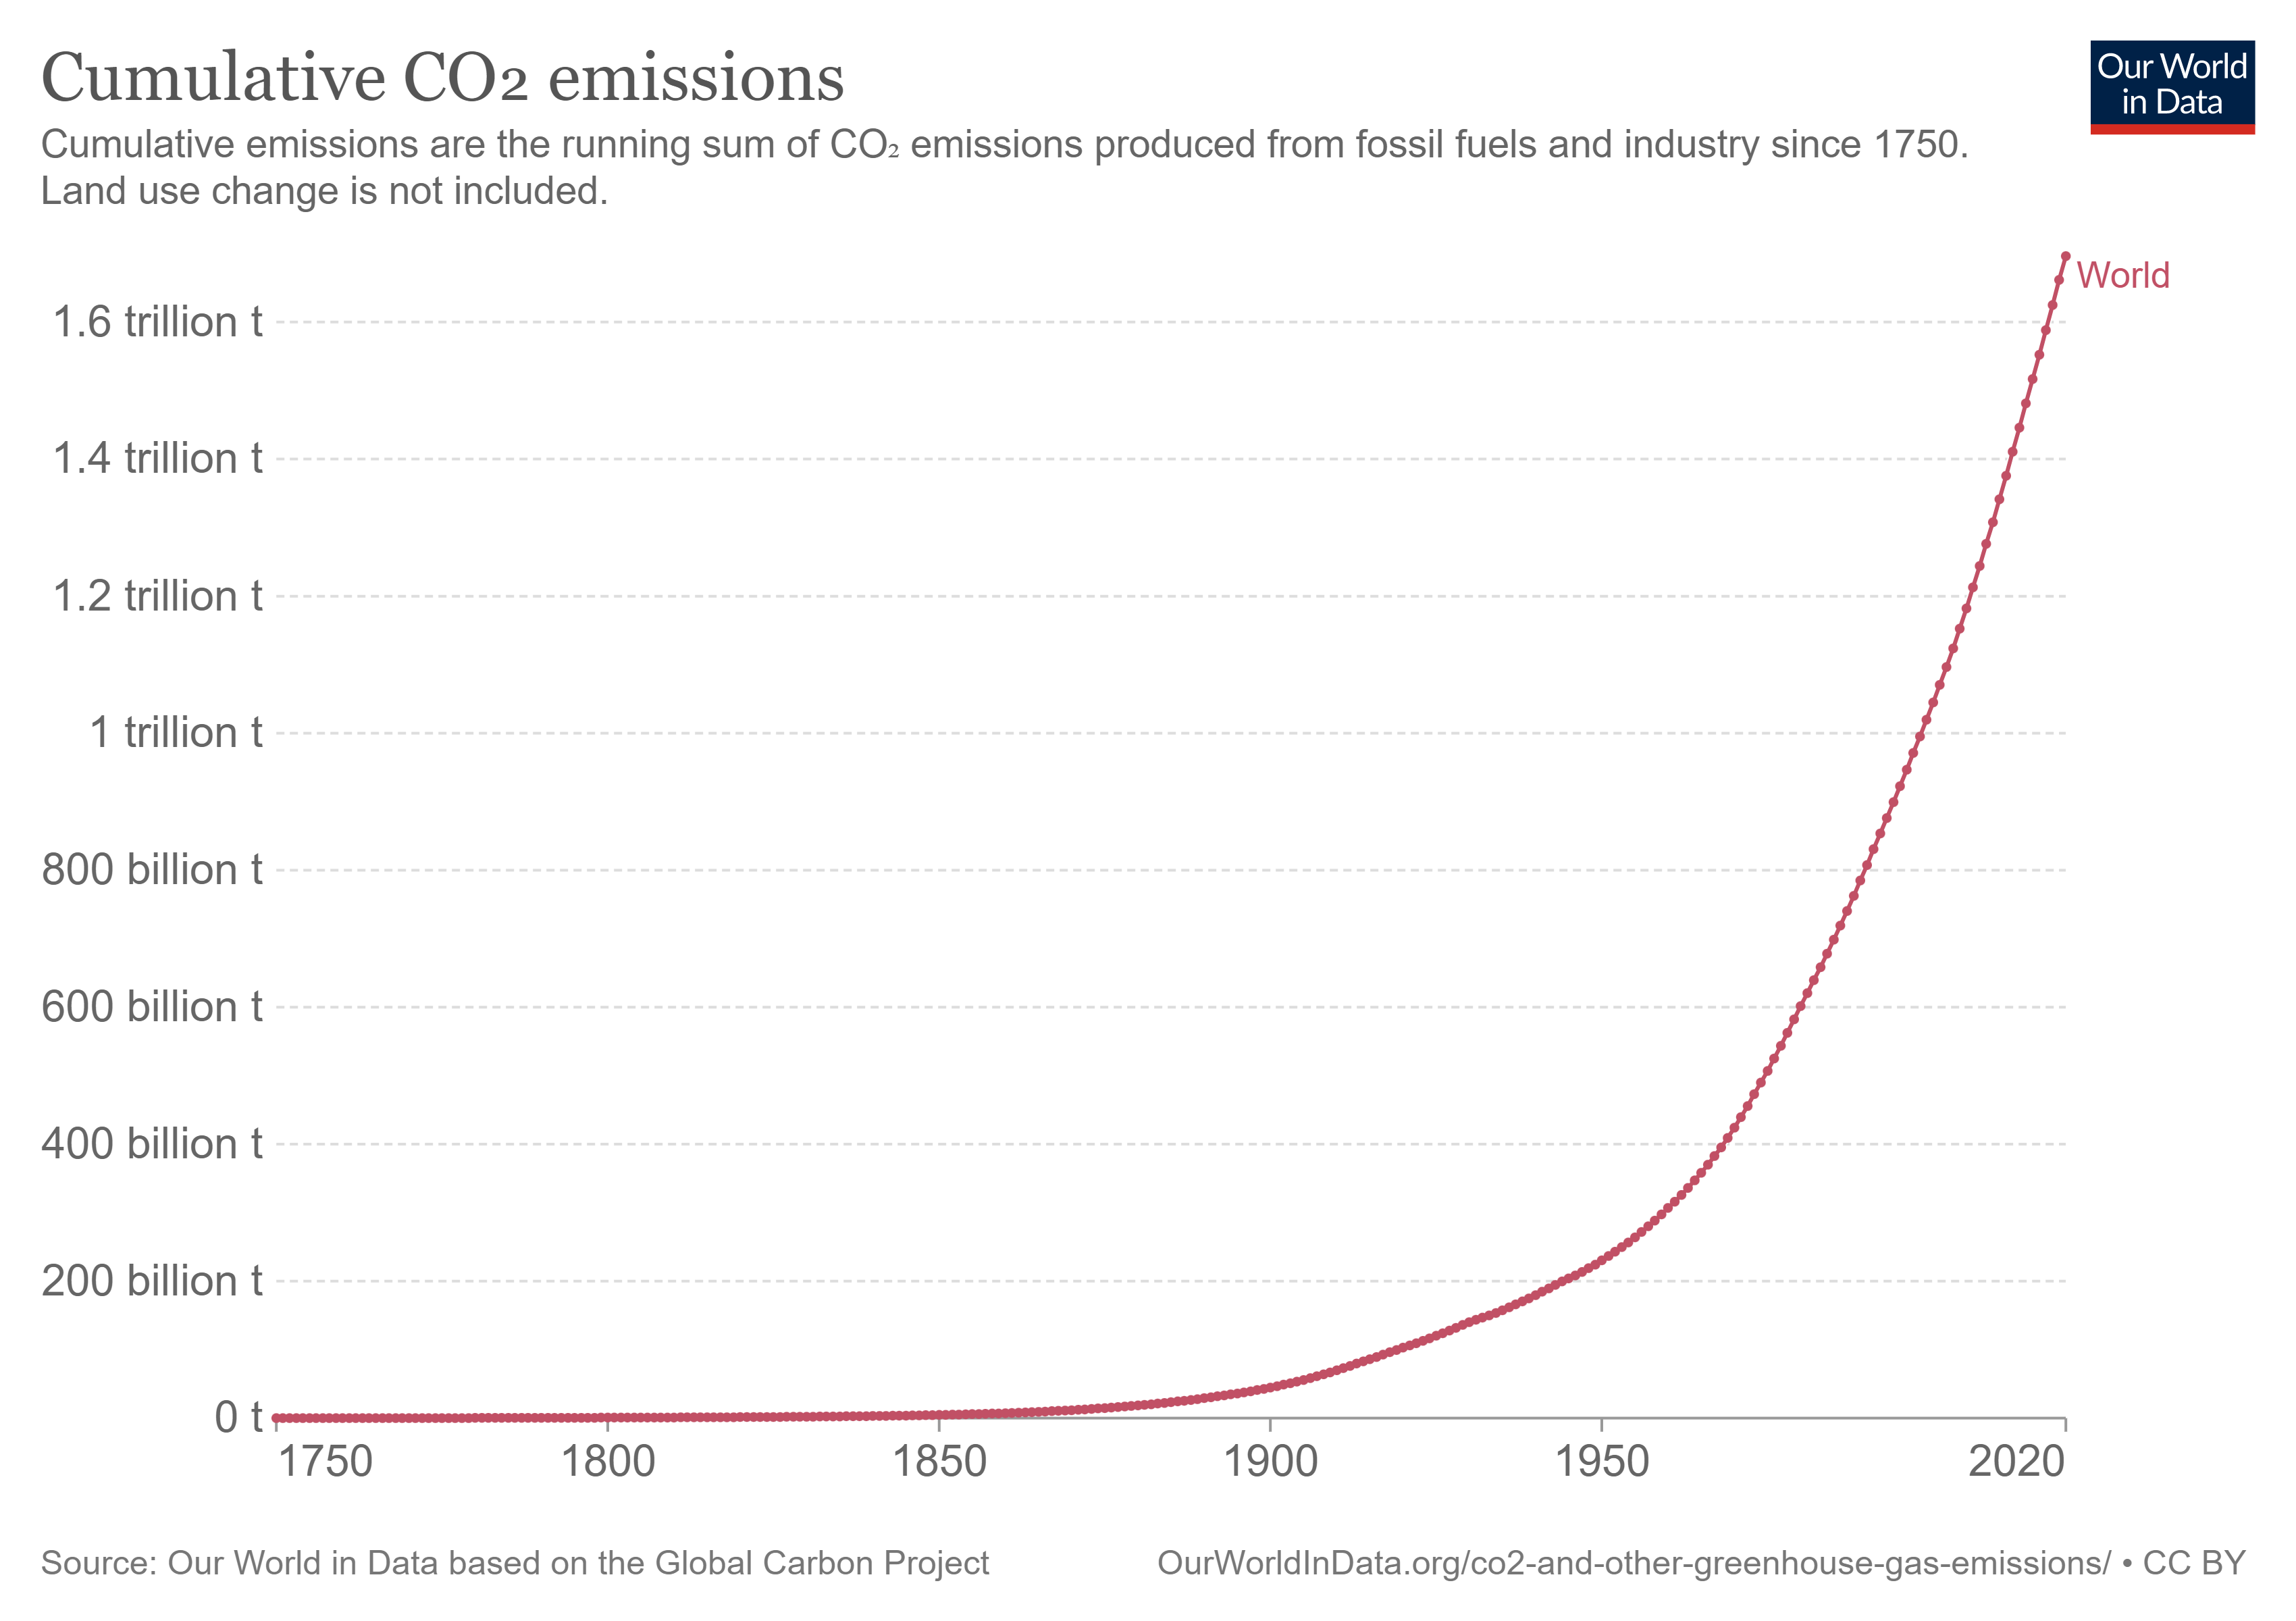
Cumulative CO₂ Emissions vs. Rate of Change
Global climate change is primarily caused by carbon dioxide emissions. Fossil fuels like coal, oil, and gas release large amounts of CO₂ when burned or used in industrial processes.
Before the Industrial Revolution (1760-1840), emissions were very low. However, with the increased use of fossil fuels to power machines, emissions rose to 6 billion tonnes of CO₂ per year globally by 1950. The amount had almost quadrupled by 1990, reaching a rate of over 22 billion tonnes per year.
Currently, the world emits over 34 billion tonnes of CO₂ each year. Since 1751, the world has emitted over 1.5 trillion tonnes of CO₂ cumulatively.
Prior to the COVID-19 pandemic, average global growth in fossil CO₂ emissions had slowed to 0.9% annually during the 2010s, reaching 36.7 gigatons of CO₂ added to the atmosphere in 2019.
However, in 2020, global lockdowns led to the biggest decrease in CO₂ emissions ever seen in absolute terms. Global fossil CO₂ emissions decreased by 5.2% to 34.8 gigatons, mainly due to halts in aviation, surface transport, power generation, and manufacturing during the pandemic.
Since then, emissions have approached pre-pandemic levels, reaching 36.2 gigatons added to the atmosphere in 2021.
Biggest Emitters, by Country
Asia, led by China, is the largest emitter, with the continent accounting for more than half of global emissions.
| Rank | Country | 2020 CO₂ Emissions (Millions of metric tons) |
|---|---|---|
| #1 | 🇨🇳 China | 10,668 |
| #2 | 🇺🇸 United States | 4,713 |
| #3 | 🇮🇳 India | 2,442 |
| #4 | 🇷🇺 Russia | 1,577 |
| #5 | 🇯🇵 Japan | 1,031 |
| #6 | 🇮🇷 Iran | 745 |
| #7 | 🇩🇪 Germany | 644 |
| #8 | 🇸🇦 Saudi Arabia | 626 |
| #9 | 🇰🇷 South Korea | 598 |
| #10 | 🇮🇩 Indonesia | 590 |
| #11 | 🇨🇦 Canada | 536 |
| #12 | 🇧🇷 Brazil | 467 |
| #13 | 🇿🇦 South Africa | 452 |
| #14 | 🇹🇷 Turkey | 393 |
| #15 | 🇦🇺 Australia | 392 |
CO₂ emissions from developing economies already account for more than two-thirds of global emissions, while emissions from advanced economies are in a structural decline.
Coal Power Generation Set for Record Increase
To avoid the worst impacts of climate change, more than 130 countries have now set or are considering a target of reducing emissions to net zero by 2050.
Much of the slowdown in emissions growth in the 2010s was attributable to the substitution of coal—the fuel that contributes most to planet-warming emissions—with gas and renewables. In addition, during the previous COP26 held in Glasgow, 40 nations agreed to phase coal out of their energy mixes.
Despite that, in 2021, coal-fired electricity generation reached all-time highs globally and is set for a new record in 2022 as consumption surged in Europe to replace shortfalls in hydro, nuclear, and Russian natural gas.
As leaders meet in Egypt for the world’s largest gathering on climate action, it will be up to them to come up with a plan for making their environmental aspirations a reality.


Energy Shift
The World’s Biggest Oil Producers in 2023
Just three countries accounted for 40% of global oil production last year.

The World’s Biggest Oil Producers in 2023
This was originally posted on our Voronoi app. Download the app for free on iOS or Android and discover incredible data-driven charts from a variety of trusted sources.
Despite efforts to decarbonize the global economy, oil still remains one of the world’s most important resources. It’s also produced by a fairly limited group of countries, which can be a source of economic and political leverage.
This graphic illustrates global crude oil production in 2023, measured in million barrels per day, sourced from the U.S. Energy Information Administration (EIA).
Three Countries Account for 40% of Global Oil Production
In 2023, the United States, Russia, and Saudi Arabia collectively contributed 32.7 million barrels per day to global oil production.
| Oil Production 2023 | Million barrels per day |
|---|---|
| 🇺🇸 U.S. | 12.9 |
| 🇷🇺 Russia | 10.1 |
| 🇸🇦 Saudi Arabia | 9.7 |
| 🇨🇦 Canada | 4.6 |
| 🇮🇶 Iraq | 4.3 |
| 🇨🇳 China | 4.2 |
| 🇮🇷 Iran | 3.6 |
| 🇧🇷 Brazil | 3.4 |
| 🇦🇪 UAE | 3.4 |
| 🇰🇼 Kuwait | 2.7 |
| 🌍 Other | 22.8 |
These three nations have consistently dominated oil production since 1971. The leading position, however, has alternated among them over the past five decades.
In contrast, the combined production of the next three largest producers—Canada, Iraq, and China—reached 13.1 million barrels per day in 2023, just surpassing the production of the United States alone.
In the near term, no country is likely to surpass the record production achieved by the U.S. in 2023, as no other producer has ever reached a daily capacity of 13.0 million barrels. Recently, Saudi Arabia’s state-owned Saudi Aramco scrapped plans to increase production capacity to 13.0 million barrels per day by 2027.
In 2024, analysts forecast that the U.S. will maintain its position as the top oil producer. In fact, according to Macquarie Group, U.S. oil production is expected to achieve a record pace of about 14 million barrels per day by the end of the year.
Energy Shift
How Much Does the U.S. Depend on Russian Uranium?
Despite a new uranium ban being discussed in Congress, the U.S. is still heavily dependent on Russian uranium.

How Much Does the U.S. Depend on Russian Uranium?
This was originally posted on our Voronoi app. Download the app for free on iOS or Android and discover incredible data-driven charts from a variety of trusted sources.
The U.S. House of Representatives recently passed a ban on imports of Russian uranium. The bill must pass the Senate before becoming law.
In this graphic, we visualize how much the U.S. relies on Russian uranium, based on data from the United States Energy Information Administration (EIA).
U.S. Suppliers of Enriched Uranium
After Russia invaded Ukraine, the U.S. imposed sanctions on Russian-produced oil and gas—yet Russian-enriched uranium is still being imported.
Currently, Russia is the largest foreign supplier of nuclear power fuel to the United States. In 2022, Russia supplied almost a quarter of the enriched uranium used to fuel America’s fleet of more than 90 commercial reactors.
| Country of enrichment service | SWU* | % |
|---|---|---|
| 🇺🇸 United States | 3,876 | 27.34% |
| 🇷🇺 Russia | 3,409 | 24.04% |
| 🇩🇪 Germany | 1,763 | 12.40% |
| 🇬🇧 United Kingdom | 1,593 | 11.23% |
| 🇳🇱 Netherlands | 1,303 | 9.20% |
| Other | 2,232 | 15.79% |
| Total | 14,176 | 100% |
SWU stands for “Separative Work Unit” in the uranium industry. It is a measure of the amount of work required to separate isotopes of uranium during the enrichment process. Source: U.S. Energy Information Administration
Most of the remaining uranium is imported from European countries, while another portion is produced by a British-Dutch-German consortium operating in the United States called Urenco.
Similarly, nearly a dozen countries around the world depend on Russia for more than half of their enriched uranium—and many of them are NATO-allied members and allies of Ukraine.
In 2023 alone, the U.S. nuclear industry paid over $800 million to Russia’s state-owned nuclear energy corporation, Rosatom, and its fuel subsidiaries.
It is important to note that 19% of electricity in the U.S. is powered by nuclear plants.
The dependency on Russian fuels dates back to the 1990s when the United States turned away from its own enrichment capabilities in favor of using down-blended stocks of Soviet-era weapons-grade uranium.
As part of the new uranium-ban bill, the Biden administration plans to allocate $2.2 billion for the expansion of uranium enrichment facilities in the United States.

-

 Electrification3 years ago
Ranked: The Top 10 EV Battery Manufacturers
-

 Electrification2 years ago
The Key Minerals in an EV Battery
-

 Real Assets3 years ago
The World’s Top 10 Gold Mining Companies
-

 Misc3 years ago
All the Metals We Mined in One Visualization
-

 Electrification3 years ago
The Biggest Mining Companies in the World in 2021
-

 Energy Shift2 years ago
What Are the Five Major Types of Renewable Energy?
-

 Electrification2 years ago
Mapped: Solar Power by Country in 2021
-

 Electrification2 years ago
The World’s Largest Nickel Mining Companies