

Energy Shift
Trading Places: Electricity from Renewables vs. Coal in G20 Nations
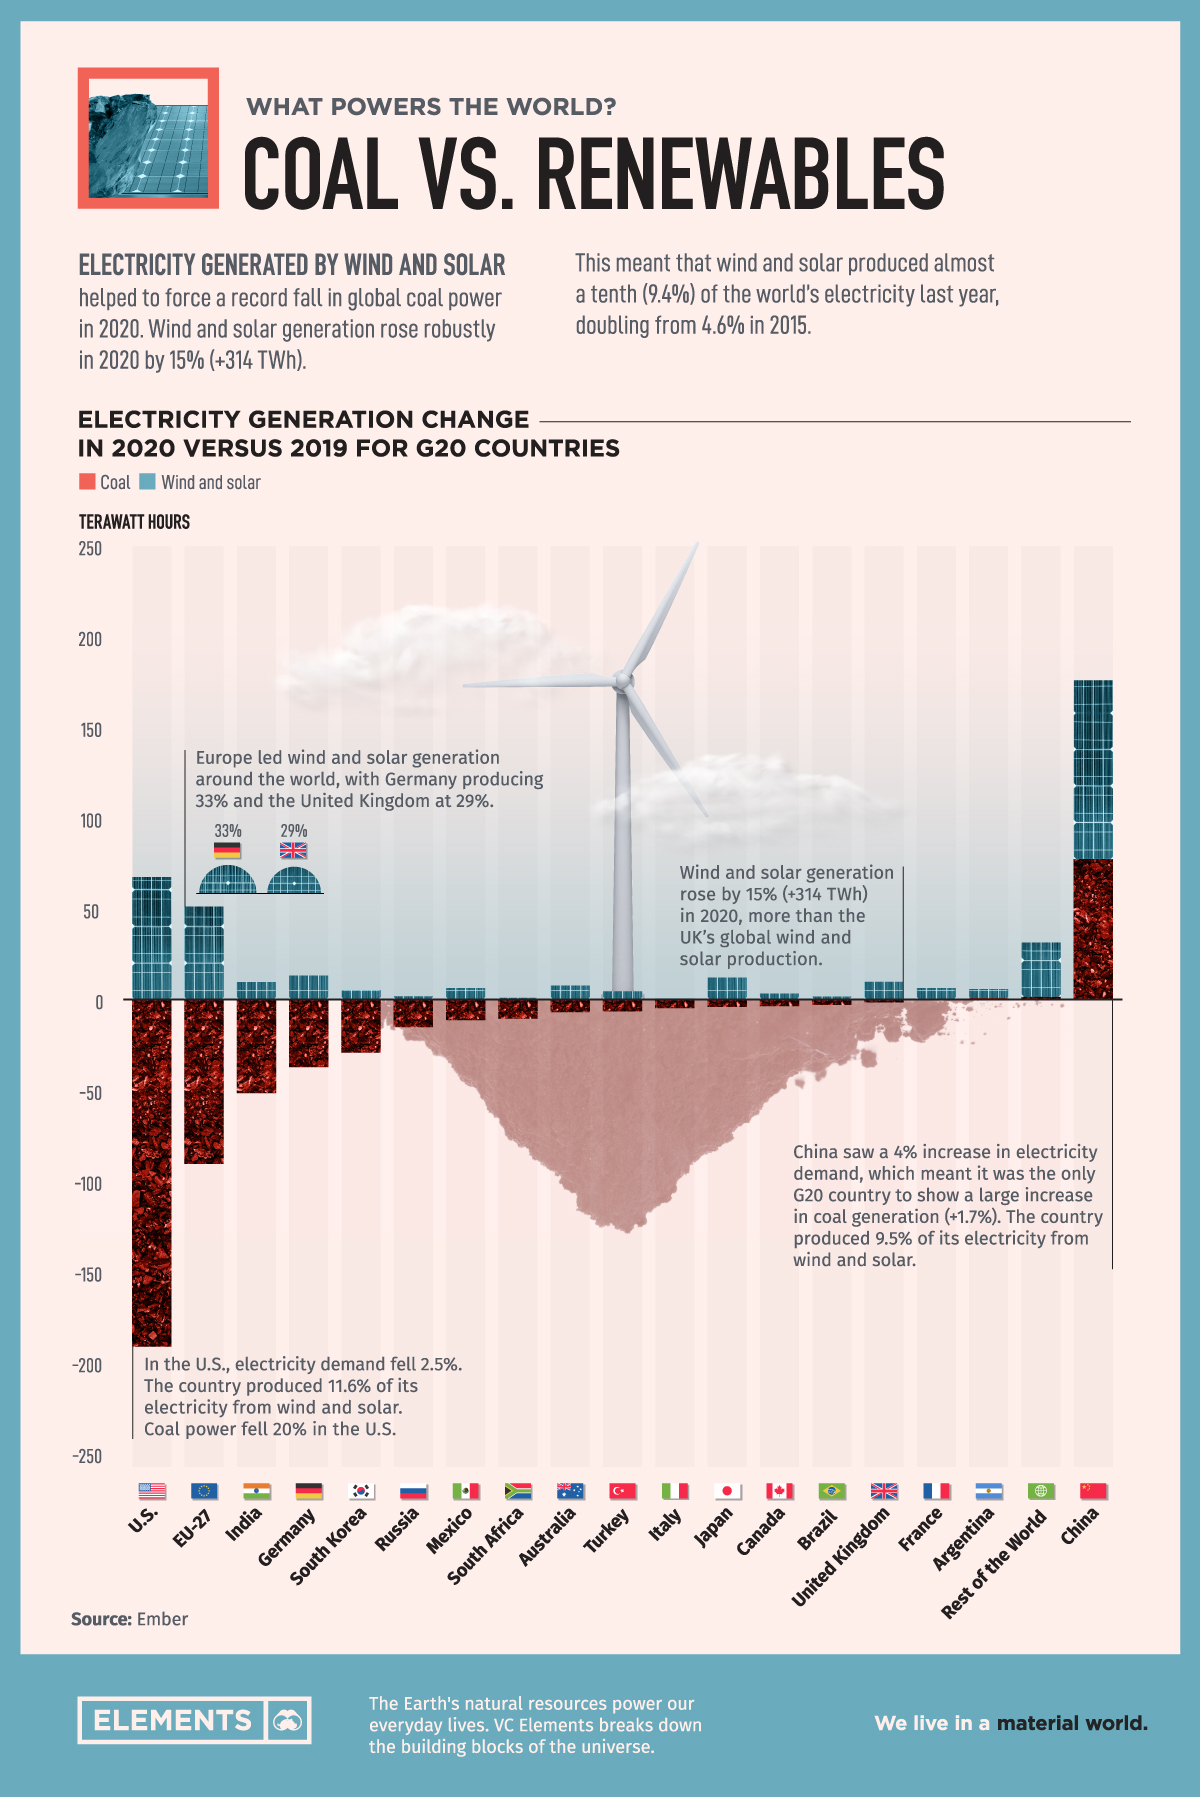
Electricity generated by new wind and solar helped to force a record fall in global coal power in 2020.
Electricity from Renewables vs. Coal in G20 Nations
As the COVID-19 pandemic has forced people to work and shop from home, cancel gatherings, and reduce the use of transportation, it has also paused the world’s rising demand for electricity.
The pandemic has opened a window of opportunity to reduce the share of power generated by fossil fuels. When demand for electricity drops, coal plants are usually switched off first since the process of burning fuels constantly runs up costs. In contrast, renewables such as wind and solar plants, once built, have significantly lower running costs.
This infographic based on Ember’s Global Electricity Review shows how wind and solar generation rose robustly in 2020 by 15% (+314 TWh), compared to 2019. That helped coal use to fall a record 4% (-346 TWh).
Accelerating the Use of Renewables
Wind and solar produced 9.4% of the world’s electricity last year, doubling from 4.6% in 2015.
Wind and solar as % share of electricity production for G20 countries
| Country | 2010 | 2015 | 2020 |
|---|---|---|---|
| Germany | 8.02% | 18.57% | 32.7% |
| United Kingdom | 2.73% | 14.26% | 28.52% |
| EU-27 | 5.52% | 12.65% | 19.57% |
| Australia | 2.28% | 6.92% | 17.09% |
| Italy | 3.7% | 13.45% | 16.54% |
| Turkey | 1.44% | 4.73% | 11.99% |
| United States | 2.32% | 5.61% | 11.58% |
| Brazil | 0.43% | 3.81% | 10.61% |
| Japan | 0.68% | 4.05% | 10.1% |
| France | 1.87% | 5.08% | 9.92% |
| Mexico | 0.49% | 2.95% | 9.78% |
| China | 1.17% | 3.92% | 9.54% |
| World | 1.81% | 4.65% | 9.42% |
| India | 2.4% | 3.45% | 8.88% |
| Argentina | 0.02% | 0.44% | 7.96% |
| Canada | 1.52% | 4.62% | 6.05% |
| South Africa | 0.02% | 2% | 5.53% |
| South Korea | 0.34% | 1.01% | 3.84% |
| Russia | 0% | 0.05% | 0.29% |
| Indonesia | 0% | 0% | 0.21% |
As you can see in the table above, many G20 countries now get around a tenth of their electricity from wind and solar, including India (9%), China (9.5%), Japan (10%), Brazil (11%), the U.S. (12%), and Turkey (12%).
Europe led wind and solar generation around the world, with Germany producing 33% and the United Kingdom at 29%. Overall, electricity demand fell 3.5% in the European Union.
Is This the End of Coal?
Coal generation collapsed almost everywhere in 2020 compared to 2019, with large falls in the U.S. (-20%), EU (-20%), and India (-5%).
China was the only G20 nation to show a large increase in coal generation (+1.7%). Overall, the country saw a 4% increase in electricity demand in 2020, as it was the first to restart production after the first months of the COVID-19 crisis.
China is now responsible for 53% of the world’s coal-fired electricity, up from 44% in 2015.
Change in coal generation, for G20 countries
| Country | 2019-2020 |
|---|---|
| China | +1.7% |
| India | -5% |
| Turkey | -6% |
| Russia | -9% |
| World | -4% |
| South Africa | -5% |
| South Korea | -13% |
| Australia | -5% |
| Japan | -1% |
| Brazil | -12% |
| Canada | -8% |
| Argentina | 0% |
| United States | -20% |
| EU-27 | -20% |
| Germany | -22% |
| Mexico | -48% |
| France | -3% |
| Italy | -24% |
| United Kingdom | -23% |
| Saudi Arabia | 0% |
The pandemic has put political leaders in a unique position: along with additional policies such as eliminating subsidies for fossil fuels and increasing investments in wind and solar power, it is now easier than ever before to accelerate the end of high-carbon electricity.


Energy Shift
The World’s Biggest Oil Producers in 2023
Just three countries accounted for 40% of global oil production last year.

The World’s Biggest Oil Producers in 2023
This was originally posted on our Voronoi app. Download the app for free on iOS or Android and discover incredible data-driven charts from a variety of trusted sources.
Despite efforts to decarbonize the global economy, oil still remains one of the world’s most important resources. It’s also produced by a fairly limited group of countries, which can be a source of economic and political leverage.
This graphic illustrates global crude oil production in 2023, measured in million barrels per day, sourced from the U.S. Energy Information Administration (EIA).
Three Countries Account for 40% of Global Oil Production
In 2023, the United States, Russia, and Saudi Arabia collectively contributed 32.7 million barrels per day to global oil production.
| Oil Production 2023 | Million barrels per day |
|---|---|
| 🇺🇸 U.S. | 12.9 |
| 🇷🇺 Russia | 10.1 |
| 🇸🇦 Saudi Arabia | 9.7 |
| 🇨🇦 Canada | 4.6 |
| 🇮🇶 Iraq | 4.3 |
| 🇨🇳 China | 4.2 |
| 🇮🇷 Iran | 3.6 |
| 🇧🇷 Brazil | 3.4 |
| 🇦🇪 UAE | 3.4 |
| 🇰🇼 Kuwait | 2.7 |
| 🌍 Other | 22.8 |
These three nations have consistently dominated oil production since 1971. The leading position, however, has alternated among them over the past five decades.
In contrast, the combined production of the next three largest producers—Canada, Iraq, and China—reached 13.1 million barrels per day in 2023, just surpassing the production of the United States alone.
In the near term, no country is likely to surpass the record production achieved by the U.S. in 2023, as no other producer has ever reached a daily capacity of 13.0 million barrels. Recently, Saudi Arabia’s state-owned Saudi Aramco scrapped plans to increase production capacity to 13.0 million barrels per day by 2027.
In 2024, analysts forecast that the U.S. will maintain its position as the top oil producer. In fact, according to Macquarie Group, U.S. oil production is expected to achieve a record pace of about 14 million barrels per day by the end of the year.
Energy Shift
How Much Does the U.S. Depend on Russian Uranium?
Despite a new uranium ban being discussed in Congress, the U.S. is still heavily dependent on Russian uranium.

How Much Does the U.S. Depend on Russian Uranium?
This was originally posted on our Voronoi app. Download the app for free on iOS or Android and discover incredible data-driven charts from a variety of trusted sources.
The U.S. House of Representatives recently passed a ban on imports of Russian uranium. The bill must pass the Senate before becoming law.
In this graphic, we visualize how much the U.S. relies on Russian uranium, based on data from the United States Energy Information Administration (EIA).
U.S. Suppliers of Enriched Uranium
After Russia invaded Ukraine, the U.S. imposed sanctions on Russian-produced oil and gas—yet Russian-enriched uranium is still being imported.
Currently, Russia is the largest foreign supplier of nuclear power fuel to the United States. In 2022, Russia supplied almost a quarter of the enriched uranium used to fuel America’s fleet of more than 90 commercial reactors.
| Country of enrichment service | SWU* | % |
|---|---|---|
| 🇺🇸 United States | 3,876 | 27.34% |
| 🇷🇺 Russia | 3,409 | 24.04% |
| 🇩🇪 Germany | 1,763 | 12.40% |
| 🇬🇧 United Kingdom | 1,593 | 11.23% |
| 🇳🇱 Netherlands | 1,303 | 9.20% |
| Other | 2,232 | 15.79% |
| Total | 14,176 | 100% |
SWU stands for “Separative Work Unit” in the uranium industry. It is a measure of the amount of work required to separate isotopes of uranium during the enrichment process. Source: U.S. Energy Information Administration
Most of the remaining uranium is imported from European countries, while another portion is produced by a British-Dutch-German consortium operating in the United States called Urenco.
Similarly, nearly a dozen countries around the world depend on Russia for more than half of their enriched uranium—and many of them are NATO-allied members and allies of Ukraine.
In 2023 alone, the U.S. nuclear industry paid over $800 million to Russia’s state-owned nuclear energy corporation, Rosatom, and its fuel subsidiaries.
It is important to note that 19% of electricity in the U.S. is powered by nuclear plants.
The dependency on Russian fuels dates back to the 1990s when the United States turned away from its own enrichment capabilities in favor of using down-blended stocks of Soviet-era weapons-grade uranium.
As part of the new uranium-ban bill, the Biden administration plans to allocate $2.2 billion for the expansion of uranium enrichment facilities in the United States.

-

 Electrification3 years ago
Ranked: The Top 10 EV Battery Manufacturers
-

 Electrification2 years ago
The Key Minerals in an EV Battery
-

 Real Assets3 years ago
The World’s Top 10 Gold Mining Companies
-

 Misc3 years ago
All the Metals We Mined in One Visualization
-

 Electrification3 years ago
The Biggest Mining Companies in the World in 2021
-

 Energy Shift2 years ago
What Are the Five Major Types of Renewable Energy?
-

 Electrification2 years ago
Mapped: Solar Power by Country in 2021
-

 Electrification2 years ago
The World’s Largest Nickel Mining Companies