

Energy Shift
Battery Megafactory Forecast: 400% Increase in Capacity to 1 TWh by 2028
Battery Megafactory Forecast
The Chart of the Week is a weekly Visual Capitalist feature on Fridays.
When ground broke on the massive Tesla Gigafactory in Nevada in 2014, the world marveled at the project’s audacity, size, and scope.
At the time, it was touted that the cutting-edge facility would be the largest building in the world by footprint, and that the Gigafactory would single-handedly be capable of doubling the world’s lithium-ion battery production capacity.
What many did not realize, however, is that although as ambitious and as forward-looking as the project sounded, the Gigafactory was just the start of a trend towards scale in the battery making space. While Tesla’s facility was the most publicized, it would ultimately be one of many massive factories in the global pipeline.
Mastering Scale
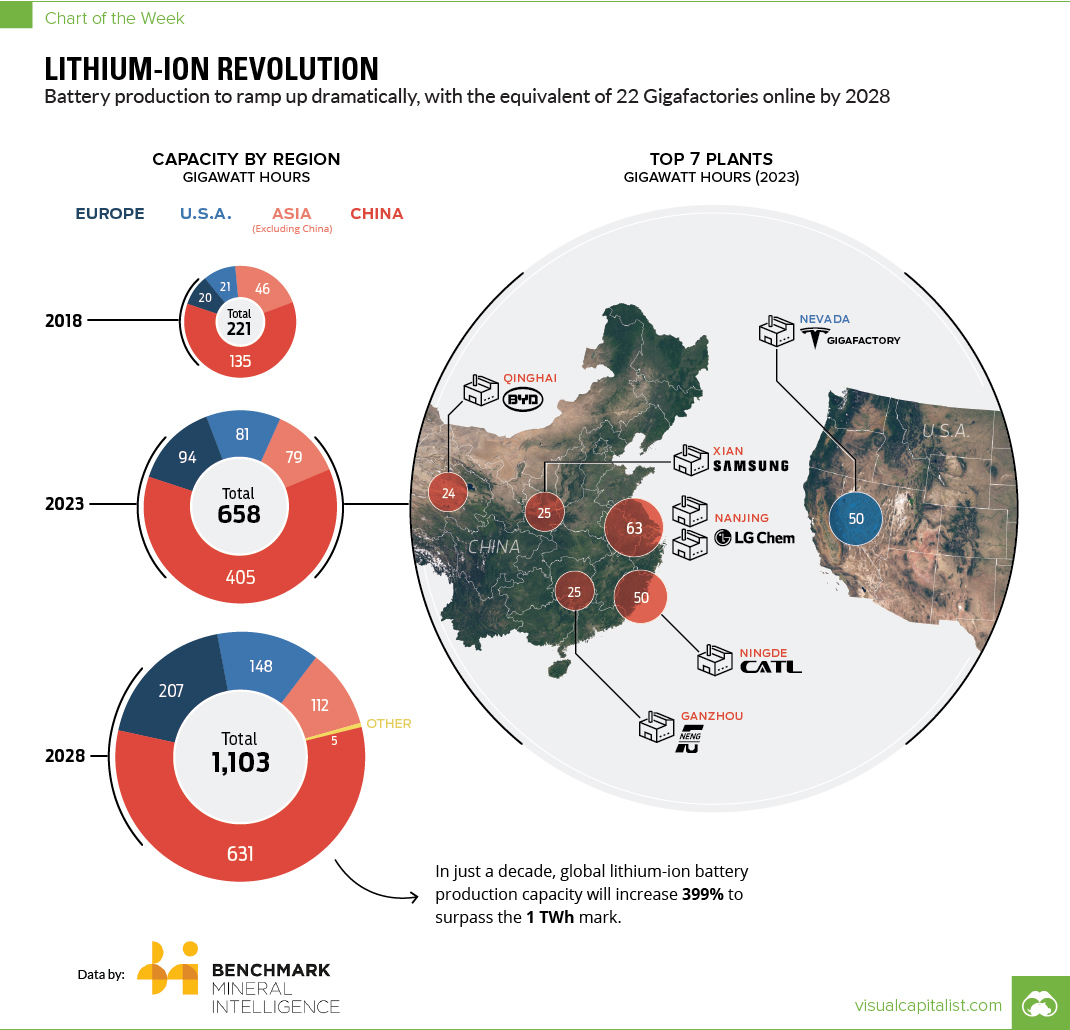
Today’s data comes to us from Benchmark Mineral Intelligence, and it forecasts that we will see a 399% increase in lithium-ion battery production capacity over the next decade – enough to pass the impressive 1 TWh milestone.
Here is a more detailed projection of how things will shape up in the coming decade:
| Region | Capacity (GWh, 2018) | Capacity (GWh, 2023) | Capacity (GWh, 2028) |
|---|---|---|---|
| China | 134.5 | 405 | 631 |
| Europe | 19.6 | 93.5 | 207 |
| North America | 20.9 | 81 | 148 |
| Other | 0 | 0 | 5 |
| Asia (excl China) | 45.5 | 78.5 | 111.5 |
| Grand Total | 220.5 | 658 | 1,102.5 |
In just a decade, lithium-ion battery megafactories around the world will have a combined production capacity equivalent to 22 Tesla Gigafactories!
The majority of this capacity will be located in China, which is projected to have 57% of the global total.
The Top Plants Globally
According to Benchmark, the top 10 megafactories will be combining for 299 GWh of capacity in 2023, which will be equal to almost half of the global production total.
Here are the top 10 plants, sorted by projected capacity:
| Rank | Megafactory | Owner | Country | Forecasted capacity by 2023 (GWh) |
|---|---|---|---|---|
| #1 | CATL | Contemporary Amperex Technology Co Ltd | China | 50 |
| #2 | Tesla Gigafactory 1 | Tesla Inc / Panasonic Corp (25%) | US | 50 |
| #3 | Nanjing LG Chem New Energy Battery Co., Ltd. | LG Chem | China | 35 |
| #4 | Nanjing LG Chem New Energy Battery Co., Ltd. Plant 2 | LG Chem | China | 28 |
| #5 | Samsung SDI Xian | Samsung SDI | China | 25 |
| #6 | Funeng Technology | Funeng Technology (Ganzhou) | China | 25 |
| #7 | BYD , Qinghai | BYD Co Ltd | China | 24 |
| #8 | LG Chem Wroclaw Energy Sp. z o.o. | LG Chem | Poland | 22 |
| #9 | Samsung SDI Korea | Samsung SDI | Korea | 20 |
| #10 | Lishen | TianJin Lishen Battery Joint-Stock CO.,LTD | China | 20 |
Of the top 10 megafactory plants in 2023, the majority will be located in China – meanwhile, the U.S. (Tesla Gigafactory), South Korea (Samsung), and Poland (LG Chem) will be home to the rest.
Reaching economies of scale in lithium-ion battery production will be a significant step in decreasing the overall cost of electric vehicles, which are expected to surpass traditional vehicles in market share by 2038.


Energy Shift
The World’s Biggest Oil Producers in 2023
Just three countries accounted for 40% of global oil production last year.

The World’s Biggest Oil Producers in 2023
This was originally posted on our Voronoi app. Download the app for free on iOS or Android and discover incredible data-driven charts from a variety of trusted sources.
Despite efforts to decarbonize the global economy, oil still remains one of the world’s most important resources. It’s also produced by a fairly limited group of countries, which can be a source of economic and political leverage.
This graphic illustrates global crude oil production in 2023, measured in million barrels per day, sourced from the U.S. Energy Information Administration (EIA).
Three Countries Account for 40% of Global Oil Production
In 2023, the United States, Russia, and Saudi Arabia collectively contributed 32.7 million barrels per day to global oil production.
| Oil Production 2023 | Million barrels per day |
|---|---|
| 🇺🇸 U.S. | 12.9 |
| 🇷🇺 Russia | 10.1 |
| 🇸🇦 Saudi Arabia | 9.7 |
| 🇨🇦 Canada | 4.6 |
| 🇮🇶 Iraq | 4.3 |
| 🇨🇳 China | 4.2 |
| 🇮🇷 Iran | 3.6 |
| 🇧🇷 Brazil | 3.4 |
| 🇦🇪 UAE | 3.4 |
| 🇰🇼 Kuwait | 2.7 |
| 🌍 Other | 22.8 |
These three nations have consistently dominated oil production since 1971. The leading position, however, has alternated among them over the past five decades.
In contrast, the combined production of the next three largest producers—Canada, Iraq, and China—reached 13.1 million barrels per day in 2023, just surpassing the production of the United States alone.
In the near term, no country is likely to surpass the record production achieved by the U.S. in 2023, as no other producer has ever reached a daily capacity of 13.0 million barrels. Recently, Saudi Arabia’s state-owned Saudi Aramco scrapped plans to increase production capacity to 13.0 million barrels per day by 2027.
In 2024, analysts forecast that the U.S. will maintain its position as the top oil producer. In fact, according to Macquarie Group, U.S. oil production is expected to achieve a record pace of about 14 million barrels per day by the end of the year.
Energy Shift
How Much Does the U.S. Depend on Russian Uranium?
Despite a new uranium ban being discussed in Congress, the U.S. is still heavily dependent on Russian uranium.

How Much Does the U.S. Depend on Russian Uranium?
This was originally posted on our Voronoi app. Download the app for free on iOS or Android and discover incredible data-driven charts from a variety of trusted sources.
The U.S. House of Representatives recently passed a ban on imports of Russian uranium. The bill must pass the Senate before becoming law.
In this graphic, we visualize how much the U.S. relies on Russian uranium, based on data from the United States Energy Information Administration (EIA).
U.S. Suppliers of Enriched Uranium
After Russia invaded Ukraine, the U.S. imposed sanctions on Russian-produced oil and gas—yet Russian-enriched uranium is still being imported.
Currently, Russia is the largest foreign supplier of nuclear power fuel to the United States. In 2022, Russia supplied almost a quarter of the enriched uranium used to fuel America’s fleet of more than 90 commercial reactors.
| Country of enrichment service | SWU* | % |
|---|---|---|
| 🇺🇸 United States | 3,876 | 27.34% |
| 🇷🇺 Russia | 3,409 | 24.04% |
| 🇩🇪 Germany | 1,763 | 12.40% |
| 🇬🇧 United Kingdom | 1,593 | 11.23% |
| 🇳🇱 Netherlands | 1,303 | 9.20% |
| Other | 2,232 | 15.79% |
| Total | 14,176 | 100% |
SWU stands for “Separative Work Unit” in the uranium industry. It is a measure of the amount of work required to separate isotopes of uranium during the enrichment process. Source: U.S. Energy Information Administration
Most of the remaining uranium is imported from European countries, while another portion is produced by a British-Dutch-German consortium operating in the United States called Urenco.
Similarly, nearly a dozen countries around the world depend on Russia for more than half of their enriched uranium—and many of them are NATO-allied members and allies of Ukraine.
In 2023 alone, the U.S. nuclear industry paid over $800 million to Russia’s state-owned nuclear energy corporation, Rosatom, and its fuel subsidiaries.
It is important to note that 19% of electricity in the U.S. is powered by nuclear plants.
The dependency on Russian fuels dates back to the 1990s when the United States turned away from its own enrichment capabilities in favor of using down-blended stocks of Soviet-era weapons-grade uranium.
As part of the new uranium-ban bill, the Biden administration plans to allocate $2.2 billion for the expansion of uranium enrichment facilities in the United States.

-

 Electrification3 years ago
Ranked: The Top 10 EV Battery Manufacturers
-

 Electrification2 years ago
The Key Minerals in an EV Battery
-

 Real Assets3 years ago
The World’s Top 10 Gold Mining Companies
-

 Misc3 years ago
All the Metals We Mined in One Visualization
-

 Electrification3 years ago
The Biggest Mining Companies in the World in 2021
-

 Energy Shift2 years ago
What Are the Five Major Types of Renewable Energy?
-

 Electrification2 years ago
The World’s Largest Nickel Mining Companies
-

 Electrification2 years ago
Mapped: Solar Power by Country in 2021