

Electrification
Mapped: Solar Power by Country in 2021
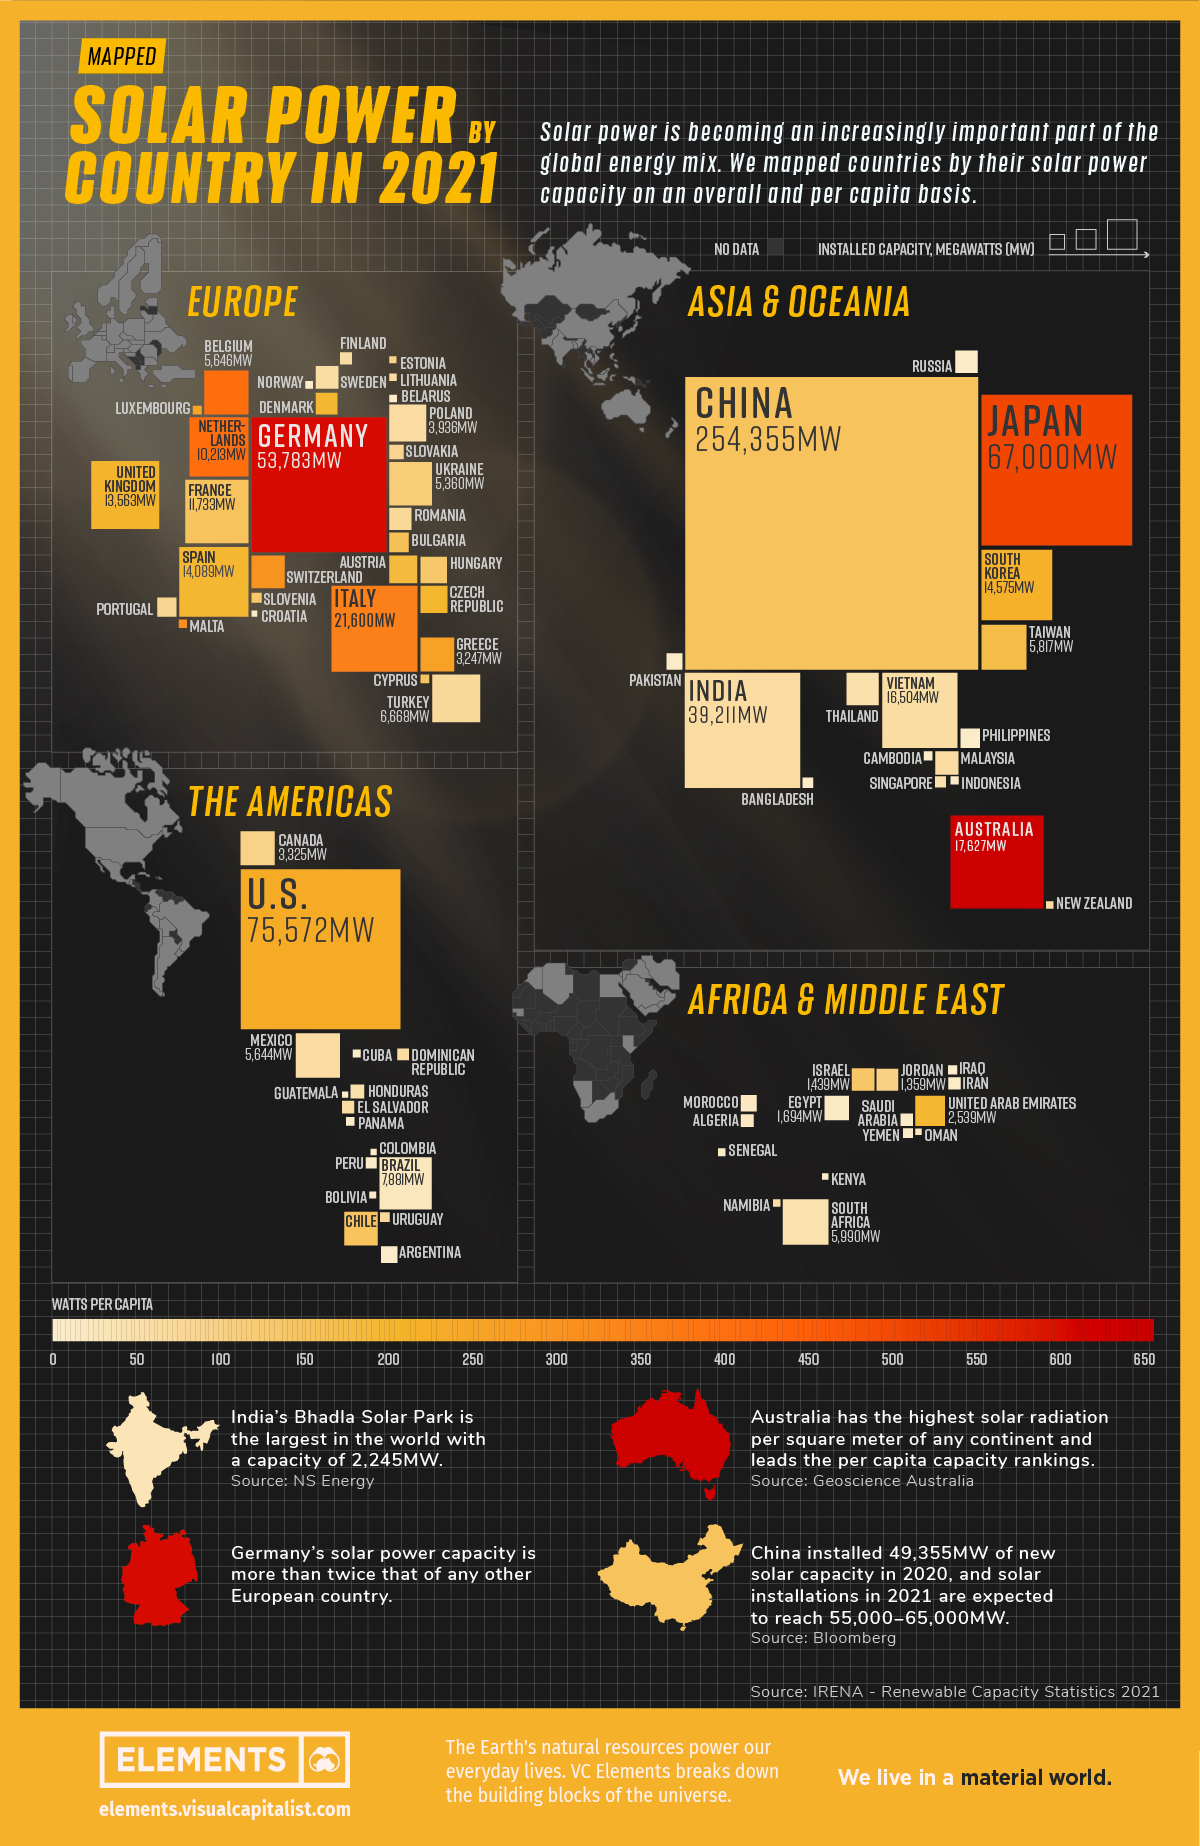


Mapped: Solar Power by Country in 2021
The world is adopting renewable energy at an unprecedented pace, and solar power is leading the way.
Despite a 4.5% fall in global energy demand in 2020, renewable energy technologies showed promising progress. While the growth in renewables was strong across the board, solar power led from the front with 127 gigawatts installed in 2020, its largest-ever annual capacity expansion.
The above infographic uses data from the International Renewable Energy Agency (IRENA) to map solar power capacity by country in 2021. This includes both solar photovoltaic (PV) and concentrated solar power capacity.
The Solar Power Leaderboard
From the Americas to Oceania, countries in virtually every continent (except Antarctica) added more solar to their mix last year. Here’s a snapshot of solar power capacity by country at the beginning of 2021:
| Country | Installed capacity, megawatts | Watts* per capita | % of world total |
|---|---|---|---|
| China 🇨🇳 | 254,355 | 147 | 35.6% |
| U.S. 🇺🇸 | 75,572 | 231 | 10.6% |
| Japan 🇯🇵 | 67,000 | 498 | 9.4% |
| Germany 🇩🇪 | 53,783 | 593 | 7.5% |
| India 🇮🇳 | 39,211 | 32 | 5.5% |
| Italy 🇮🇹 | 21,600 | 345 | 3.0% |
| Australia 🇦🇺 | 17,627 | 637 | 2.5% |
| Vietnam 🇻🇳 | 16,504 | 60 | 2.3% |
| South Korea 🇰🇷 | 14,575 | 217 | 2.0% |
| Spain 🇪🇸 | 14,089 | 186 | 2.0% |
| United Kingdom 🇬🇧 | 13,563 | 200 | 1.9% |
| France 🇫🇷 | 11,733 | 148 | 1.6% |
| Netherlands 🇳🇱 | 10,213 | 396 | 1.4% |
| Brazil 🇧🇷 | 7,881 | 22 | 1.1% |
| Turkey 🇹🇷 | 6,668 | 73 | 0.9% |
| South Africa 🇿🇦 | 5,990 | 44 | 0.8% |
| Taiwan 🇹🇼 | 5,817 | 172 | 0.8% |
| Belgium 🇧🇪 | 5,646 | 394 | 0.8% |
| Mexico 🇲🇽 | 5,644 | 35 | 0.8% |
| Ukraine 🇺🇦 | 5,360 | 114 | 0.8% |
| Poland 🇵🇱 | 3,936 | 34 | 0.6% |
| Canada 🇨🇦 | 3,325 | 88 | 0.5% |
| Greece 🇬🇷 | 3,247 | 258 | 0.5% |
| Chile 🇨🇱 | 3,205 | 142 | 0.4% |
| Switzerland 🇨🇭 | 3,118 | 295 | 0.4% |
| Thailand 🇹🇭 | 2,988 | 43 | 0.4% |
| United Arab Emirates 🇦🇪 | 2,539 | 185 | 0.4% |
| Austria 🇦🇹 | 2,220 | 178 | 0.3% |
| Czech Republic 🇨🇿 | 2,073 | 194 | 0.3% |
| Hungary 🇭🇺 | 1,953 | 131 | 0.3% |
| Egypt 🇪🇬 | 1,694 | 17 | 0.2% |
| Malaysia 🇲🇾 | 1,493 | 28 | 0.2% |
| Israel 🇮🇱 | 1,439 | 134 | 0.2% |
| Russia 🇷🇺 | 1,428 | 7 | 0.2% |
| Sweden 🇸🇪 | 1,417 | 63 | 0.2% |
| Romania 🇷🇴 | 1,387 | 71 | 0.2% |
| Jordan 🇯🇴 | 1,359 | 100 | 0.2% |
| Denmark 🇩🇰 | 1,300 | 186 | 0.2% |
| Bulgaria 🇧🇬 | 1,073 | 152 | 0.2% |
| Philippines 🇵🇭 | 1,048 | 9 | 0.1% |
| Portugal 🇵🇹 | 1,025 | 81 | 0.1% |
| Argentina 🇦🇷 | 764 | 17 | 0.1% |
| Pakistan 🇵🇰 | 737 | 6 | 0.1% |
| Morocco 🇲🇦 | 734 | 6 | 0.1% |
| Slovakia 🇸🇰 | 593 | 87 | 0.1% |
| Honduras 🇭🇳 | 514 | 53 | 0.1% |
| Algeria 🇩🇿 | 448 | 10 | 0.1% |
| El Salvador 🇸🇻 | 429 | 66 | 0.1% |
| Iran 🇮🇷 | 414 | 5 | 0.1% |
| Saudi Arabia 🇸🇦 | 409 | 12 | 0.1% |
| Finland 🇫🇮 | 391 | 39 | 0.1% |
| Dominican Republic 🇩🇴 | 370 | 34 | 0.1% |
| Peru 🇵🇪 | 331 | 10 | 0.05% |
| Singapore 🇸🇬 | 329 | 45 | 0.05% |
| Bangladesh 🇧🇩 | 301 | 2 | 0.04% |
| Slovenia 🇸🇮 | 267 | 128 | 0.04% |
| Uruguay 🇺🇾 | 256 | 74 | 0.04% |
| Yemen 🇾🇪 | 253 | 8 | 0.04% |
| Iraq 🇮🇶 | 216 | 5 | 0.03% |
| Cambodia 🇰🇭 | 208 | 12 | 0.03% |
| Cyprus 🇨🇾 | 200 | 147 | 0.03% |
| Panama 🇵🇦 | 198 | 46 | 0.03% |
| Luxembourg 🇱🇺 | 195 | 244 | 0.03% |
| Malta 🇲🇹 | 184 | 312 | 0.03% |
| Indonesia 🇮🇩 | 172 | 1 | 0.02% |
| Cuba 🇨🇺 | 163 | 14 | 0.02% |
| Belarus 🇧🇾 | 159 | 17 | 0.02% |
| Senegal 🇸🇳 | 155 | 8 | 0.02% |
| Norway 🇳🇴 | 152 | 17 | 0.02% |
| Lithuania 🇱🇹 | 148 | 37 | 0.02% |
| Namibia 🇳🇦 | 145 | 55 | 0.02% |
| New Zealand 🇳🇿 | 142 | 29 | 0.02% |
| Estonia 🇪🇪 | 130 | 98 | 0.02% |
| Bolivia 🇧🇴 | 120 | 10 | 0.02% |
| Oman 🇴🇲 | 109 | 21 | 0.02% |
| Colombia 🇨🇴 | 107 | 2 | 0.01% |
| Kenya 🇰🇪 | 106 | 2 | 0.01% |
| Guatemala 🇬🇹 | 101 | 6 | 0.01% |
| Croatia 🇭🇷 | 85 | 17 | 0.01% |
| World total 🌎 | 713,970 | 83 | 100.0% |
*1 megawatt = 1,000,000 watts.
China is the undisputed leader in solar installations, with over 35% of global capacity. What’s more, the country is showing no signs of slowing down. It has the world’s largest wind and solar project in the pipeline, which could add another 400,000MW to its clean energy capacity.
Following China from afar is the U.S., which recently surpassed 100,000MW of solar power capacity after installing another 50,000MW in the first three months of 2021. Annual solar growth in the U.S. has averaged an impressive 42% over the last decade. Policies like the solar investment tax credit, which offers a 26% tax credit on residential and commercial solar systems, have helped propel the industry forward.
Although Australia hosts a fraction of China’s solar capacity, it tops the per capita rankings due to its relatively low population of 26 million people. The Australian continent receives the highest amount of solar radiation of any continent, and over 30% of Australian households now have rooftop solar PV systems.
China: The Solar Champion
In 2020, President Xi Jinping stated that China aims to be carbon neutral by 2060, and the country is taking steps to get there.
China is a leader in the solar industry, and it seems to have cracked the code for the entire solar supply chain. In 2019, Chinese firms produced 66% of the world’s polysilicon, the initial building block of silicon-based photovoltaic (PV) panels. Furthermore, more than three-quarters of solar cells came from China, along with 72% of the world’s PV panels.
With that said, it’s no surprise that 5 of the world’s 10 largest solar parks are in China, and it will likely continue to build more as it transitions to carbon neutrality.
What’s Driving the Rush for Solar Power?
The energy transition is a major factor in the rise of renewables, but solar’s growth is partly due to how cheap it has become over time. Solar energy costs have fallen exponentially over the last decade, and it’s now the cheapest source of new energy generation.
Since 2010, the cost of solar power has seen a 85% decrease, down from $0.28 to $0.04 per kWh. According to MIT researchers, economies of scale have been the single-largest factor in continuing the cost decline for the last decade. In other words, as the world installed and made more solar panels, production became cheaper and more efficient.
This year, solar costs are rising due to supply chain issues, but the rise is likely to be temporary as bottlenecks resolve.


Electrification
Ranked: The Top 10 EV Battery Manufacturers in 2023
Asia dominates this ranking of the world’s largest EV battery manufacturers in 2023.

The Top 10 EV Battery Manufacturers in 2023
This was originally posted on our Voronoi app. Download the app for free on iOS or Android and discover incredible data-driven charts from a variety of trusted sources.
Despite efforts from the U.S. and EU to secure local domestic supply, all major EV battery manufacturers remain based in Asia.
In this graphic we rank the top 10 EV battery manufacturers by total battery deployment (measured in megawatt-hours) in 2023. The data is from EV Volumes.
Chinese Dominance
Contemporary Amperex Technology Co. Limited (CATL) has swiftly risen in less than a decade to claim the title of the largest global battery group.
The Chinese company now has a 34% share of the market and supplies batteries to a range of made-in-China vehicles, including the Tesla Model Y, SAIC’s MG4/Mulan, and Li Auto models.
| Company | Country | 2023 Production (megawatt-hour) | Share of Total Production |
|---|---|---|---|
| CATL | 🇨🇳China | 242,700 | 34% |
| BYD | 🇨🇳China | 115,917 | 16% |
| LG Energy Solution | 🇰🇷Korea | 108,487 | 15% |
| Panasonic | 🇯🇵Japan | 56,560 | 8% |
| SK On | 🇰🇷Korea | 40,711 | 6% |
| Samsung SDI | 🇰🇷Korea | 35,703 | 5% |
| CALB | 🇨🇳China | 23,493 | 3% |
| Farasis Energy | 🇨🇳China | 16,527 | 2% |
| Envision AESC | 🇨🇳China | 8,342 | 1% |
| Sunwoda | 🇨🇳China | 6,979 | 1% |
| Other | - | 56,040 | 8% |
In 2023, BYD surpassed LG Energy Solution to claim second place. This was driven by demand from its own models and growth in third-party deals, including providing batteries for the made-in-Germany Tesla Model Y, Toyota bZ3, Changan UNI-V, Venucia V-Online, as well as several Haval and FAW models.
The top three battery makers (CATL, BYD, LG) collectively account for two-thirds (66%) of total battery deployment.
Once a leader in the EV battery business, Panasonic now holds the fourth position with an 8% market share, down from 9% last year. With its main client, Tesla, now effectively sourcing batteries from multiple suppliers, the Japanese battery maker seems to be losing its competitive edge in the industry.
Overall, the global EV battery market size is projected to grow from $49 billion in 2022 to $98 billion by 2029, according to Fortune Business Insights.
Electrification
White Gold: Mapping U.S. Lithium Mines
In this graphic, Visual Capitalist partnerered with EnergyX to explore the size and location of U.S. lithium mines.

White Gold: Mapping U.S. Lithium Mines
The U.S. doubled imports of lithium-ion batteries for the third consecutive year in 2022, and with EV demand growing yearly, U.S. lithium mines must ramp up production or rely on other nations for their supply of refined lithium.
To determine if the domestic U.S. lithium opportunity can meet demand, we partnered with EnergyX to determine how much lithium sits within U.S. borders.
U.S. Lithium Projects
The most crucial measure of a lithium mine’s potential is the quantity that can be extracted from the source.
For each lithium resource, the potential volume of lithium carbonate equivalent (LCE) was calculated with a ratio of one metric ton of lithium producing 5.32 metric tons of LCE. Cumulatively, existing U.S. lithium projects contain 94.8 million metric tons of LCE.
| Rank | Project Name | LCE, million metric tons (est.) |
|---|---|---|
| 1 | McDermitt Caldera | 21.5 |
| 2 | Thacker Pass | 19.1 |
| 3 | Tonopah Flats | 18.0 |
| 4 | TLC Lithium | 10.7 |
| 5 | Clayton Valley (Century Lithium) | 6.3 |
| 6 | Zeus Lithium | 6.3 |
| 7 | Rhyolite Ridge | 3.4 |
| 8 | Arkansas Smackover (Phase 1A) | 2.8 |
| 9 | Basin Project | 2.2 |
| 10 | McGee Deposit | 2.1 |
| 11 | Arkansas Smackover (South West) | 1.8 |
| 12 | Clayton Valley (Lithium-X, Pure Energy) | 0.8 |
| 13 | Big Sandy | 0.3 |
| 14 | Imperial Valley/Salton Sea | 0.3 |
U.S. Lithium Opportunities, By State
U.S. lithium projects mainly exist in western states, with comparatively minor opportunities in central or eastern states.
| State | LCE, million metric tons (est.) |
|---|---|
| Nevada | 88.2 |
| Arkansas | 4.6 |
| Arizona | 2.5 |
| California | 0.3 |
Currently, the U.S. is sitting on a wealth of lithium that it is underutilizing. For context, in 2022, the U.S. only produced about 5,000 metric tons of LCE and imported a projected 19,000 metric tons of LCE, showing that the demand for the mineral is healthy.
The Next Gold Rush?
U.S. lithium companies have the opportunity to become global leaders in lithium production and accelerate the transition to sustainable energy sources. This is particularly important as the demand for lithium is increasing every year.
EnergyX is on a mission to meet U.S. lithium demands using groundbreaking technology that can extract 300% more lithium from a source than traditional methods.
You can take advantage of this opportunity by investing in EnergyX and joining other significant players like GM in becoming a shareholder.


-

 Electrification3 years ago
Ranked: The Top 10 EV Battery Manufacturers
-

 Electrification2 years ago
The Key Minerals in an EV Battery
-

 Real Assets3 years ago
The World’s Top 10 Gold Mining Companies
-

 Misc3 years ago
All the Metals We Mined in One Visualization
-

 Electrification3 years ago
The Biggest Mining Companies in the World in 2021
-

 Energy Shift2 years ago
What Are the Five Major Types of Renewable Energy?
-

 Electrification2 years ago
The World’s Largest Nickel Mining Companies
-

 Electrification3 years ago
How Much Land is Needed to Power the U.S. with Solar?