

Energy Shift
Mapped: Europe’s Biggest Sources of Electricity by Country
Mapped: Europe’s Biggest Sources of Electricity by Country
Energy and electricity supply have become vital for nearly every European nation over the past year, as the region shifts away from its dependence on Russian fuel imports.
While many countries have been making progress in their energy transition away from fossil fuels, nearly half of European countries are still dependent on them as their primary source of electricity generation.
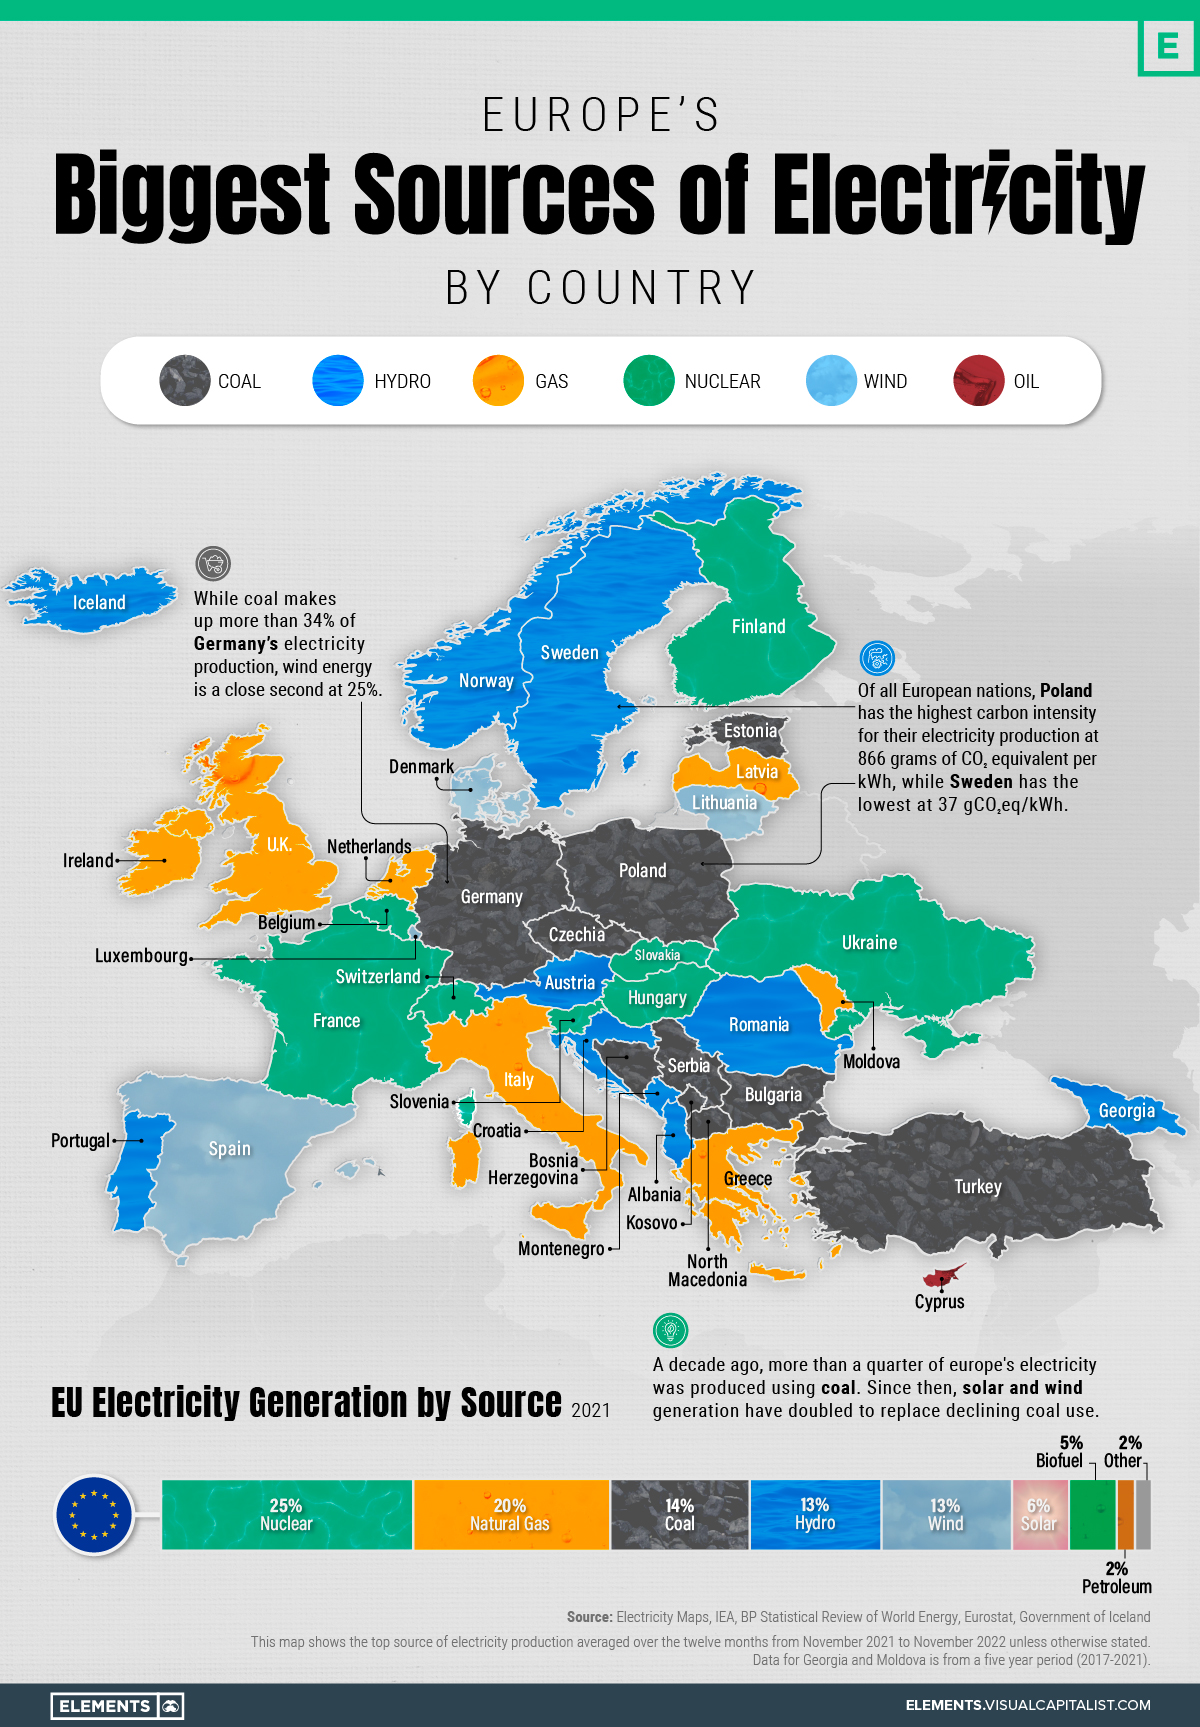
This graphic maps out European countries by their top source of electricity generation using data from Electricity Maps and the IEA, along with a breakdown of the EU’s overall electricity generation by source in 2021.
Europe’s Electricity Generation by Energy Source
Europe has been steadily transitioning towards renewable sources of energy for their electricity generation, making considerable progress over the last decade.
In 2011, fossil fuels (oil, natural gas, and coal) made up 49% of the EU’s electricity production while renewable energy sources only made up 18%. A decade later, renewable energy sources are coming close to equaling fossil fuels, with renewables making up 32% of the EU’s electricity generation compared to fossil fuels’ 36% in 2021.
| Source | EU Electricity Generation Share (2011) | EU Electricity Generation Share (2021) |
|---|---|---|
| Nuclear | 29% | 25% |
| Coal | 25% | 14% |
| Natural Gas | 19% | 20% |
| Hydropower | 10% | 13% |
| Wind | 6% | 13% |
| Oil | 5% | 2% |
| Solar | 2% | 6% |
| Biofuel | 4% | 5% |
| Other | n/a | 2% |
The expansion of wind and solar generation have been the primary drivers in this shift towards renewables, going from only generating 8% of the EU’s electricity in 2011 all the way to 19% in 2021. While this might still seem small, the EU’s share of wind and solar electricity generation is tied for first alongside Oceania when compared to other regions around the world.
While hydropower doesn’t make up as big of a share as other sources, it’s the most common primary source of electricity generation in Europe, playing an important role in providing renewable energy.
Nuclear energy is the largest single source of electricity generation in the EU and across Europe despite its decline over the past couple of decades. Back in 2001, nuclear energy made up one-third (33%) of the EU’s electricity generation, and in the following 20 years fell down to 25%.
The Primary Electricity Sources of Europe’s Major Nations
When looking at individual nations, the majority of Europe’s largest countries have fossil fuels as their largest primary single source of electricity.
Germany remains heavily reliant on coal power, which from 2017 to 2021 generated 31% of the nation’s electricity. Despite the dependence on the carbon intensive fossil fuel, wind and solar energy generation together made up more of Germany’s electricity generation at 33% (23% for wind and 10% for solar).
France is Europe’s largest economy that primarily relies on nuclear power, with nuclear power making up more than half of the country’s electricity production.
Italy, the UK, and the Netherlands are all primarily natural gas powered when it comes to their electricity generation from 2017 to 2021. While Italy is the most reliant of the three at 42% of electricity generated by natural gas, the Netherlands (40%), and the UK (38%) aren’t too far off.
Spain is an outlier among major European nations and a success story in a transition towards renewable energy sources. While in the period from 2017-2021 the country was primarily dependent on natural gas (29%), in 2022 natural gas’ contribution to electricity generation fell to 14% as wind rose up to become the primary electricity generator with a 32% share.
Accelerating the EU’s Energy Transition
Since Russia’s invasion of Ukraine, energy independence in the EU has become of utmost importance, and countries have taken the opportunity to accelerate their transition towards renewable energy sources.
A new report from Ember highlights how the transition made considerable progress in 2022, with solar and wind power (22%) overtaking natural gas (20%) in electricity generation for the first time ever.
While 2022 did see an increase in fossil fuel electricity generation for the EU, Ember is expecting it to decline in 2023 by as much as 20%. If the EU can sustain this accelerated shift away from fossil fuels, this map of primary energy sources of electricity generation could feature many more renewable and low-carbon energy sources in the near future.


Energy Shift
Who’s Building the Most Solar Energy?
China’s solar capacity triples USA, nearly doubles EU.

Who’s Building the Most Solar Energy?
This was originally posted on our Voronoi app. Download the app for free on iOS or Android and discover incredible data-driven charts from a variety of trusted sources.
In 2023, solar energy accounted for three-quarters of renewable capacity additions worldwide. Most of this growth occurred in Asia, the EU, and the U.S., continuing a trend observed over the past decade.
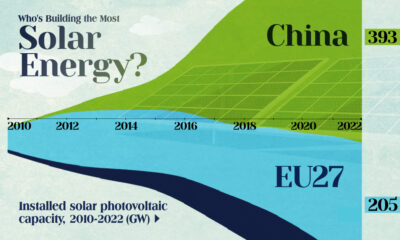
In this graphic, we illustrate the rise in installed solar photovoltaic (PV) capacity in China, the EU, and the U.S. between 2010 and 2022, measured in gigawatts (GW). Bruegel compiled the data..
Chinese Dominance
As of 2022, China’s total installed capacity stands at 393 GW, nearly double that of the EU’s 205 GW and surpassing the USA’s total of 113 GW by more than threefold in absolute terms.
| Installed solar capacity (GW) | China | EU27 | U.S. |
|---|---|---|---|
| 2022 | 393.0 | 205.5 | 113.0 |
| 2021 | 307.0 | 162.7 | 95.4 |
| 2020 | 254.0 | 136.9 | 76.4 |
| 2019 | 205.0 | 120.1 | 61.6 |
| 2018 | 175.3 | 104.0 | 52.0 |
| 2017 | 130.8 | 96.2 | 43.8 |
| 2016 | 77.8 | 91.5 | 35.4 |
| 2015 | 43.6 | 87.7 | 24.2 |
| 2014 | 28.4 | 83.6 | 18.1 |
| 2013 | 17.8 | 79.7 | 13.3 |
| 2012 | 6.7 | 71.1 | 8.6 |
| 2011 | 3.1 | 53.3 | 5.6 |
| 2010 | 1.0 | 30.6 | 3.4 |
Since 2017, China has shown a compound annual growth rate (CAGR) of approximately 25% in installed PV capacity, while the USA has seen a CAGR of 21%, and the EU of 16%.
Additionally, China dominates the production of solar power components, currently controlling around 80% of the world’s solar panel supply chain.
In 2022, China’s solar industry employed 2.76 million individuals, with manufacturing roles representing approximately 1.8 million and the remaining 918,000 jobs in construction, installation, and operations and maintenance.
The EU industry employed 648,000 individuals, while the U.S. reached 264,000 jobs.
According to the IEA, China accounts for almost 60% of new renewable capacity expected to become operational globally by 2028.
Despite the phasing out of national subsidies in 2020 and 2021, deployment of solar PV in China is accelerating. The country is expected to reach its national 2030 target for wind and solar PV installations in 2024, six years ahead of schedule.
Energy Shift
The World’s Biggest Oil Producers in 2023
Just three countries accounted for 40% of global oil production last year.

The World’s Biggest Oil Producers in 2023
This was originally posted on our Voronoi app. Download the app for free on iOS or Android and discover incredible data-driven charts from a variety of trusted sources.
Despite efforts to decarbonize the global economy, oil still remains one of the world’s most important resources. It’s also produced by a fairly limited group of countries, which can be a source of economic and political leverage.
This graphic illustrates global crude oil production in 2023, measured in million barrels per day, sourced from the U.S. Energy Information Administration (EIA).
Three Countries Account for 40% of Global Oil Production
In 2023, the United States, Russia, and Saudi Arabia collectively contributed 32.7 million barrels per day to global oil production.
| Oil Production 2023 | Million barrels per day |
|---|---|
| 🇺🇸 U.S. | 12.9 |
| 🇷🇺 Russia | 10.1 |
| 🇸🇦 Saudi Arabia | 9.7 |
| 🇨🇦 Canada | 4.6 |
| 🇮🇶 Iraq | 4.3 |
| 🇨🇳 China | 4.2 |
| 🇮🇷 Iran | 3.6 |
| 🇧🇷 Brazil | 3.4 |
| 🇦🇪 UAE | 3.4 |
| 🇰🇼 Kuwait | 2.7 |
| 🌍 Other | 22.8 |
These three nations have consistently dominated oil production since 1971. The leading position, however, has alternated among them over the past five decades.
In contrast, the combined production of the next three largest producers—Canada, Iraq, and China—reached 13.1 million barrels per day in 2023, just surpassing the production of the United States alone.
In the near term, no country is likely to surpass the record production achieved by the U.S. in 2023, as no other producer has ever reached a daily capacity of 13.0 million barrels. Recently, Saudi Arabia’s state-owned Saudi Aramco scrapped plans to increase production capacity to 13.0 million barrels per day by 2027.
In 2024, analysts forecast that the U.S. will maintain its position as the top oil producer. In fact, according to Macquarie Group, U.S. oil production is expected to achieve a record pace of about 14 million barrels per day by the end of the year.

-

 Electrification3 years ago
Ranked: The Top 10 EV Battery Manufacturers
-

 Electrification2 years ago
The Key Minerals in an EV Battery
-

 Real Assets3 years ago
The World’s Top 10 Gold Mining Companies
-

 Misc3 years ago
All the Metals We Mined in One Visualization
-

 Energy Shift2 years ago
What Are the Five Major Types of Renewable Energy?
-

 Electrification2 years ago
Mapped: Solar Power by Country in 2021
-

 Electrification2 years ago
The World’s Largest Nickel Mining Companies
-

 Electrification3 years ago
How Much Land is Needed to Power the U.S. with Solar?