

Energy Shift
Who’s Building the Most Solar Energy?
![]() See this visualization first on the Voronoi app.
See this visualization first on the Voronoi app.
Who’s Building the Most Solar Energy?
This was originally posted on our Voronoi app. Download the app for free on iOS or Android and discover incredible data-driven charts from a variety of trusted sources.
In 2023, solar energy accounted for three-quarters of renewable capacity additions worldwide. Most of this growth occurred in Asia, the EU, and the U.S., continuing a trend observed over the past decade.
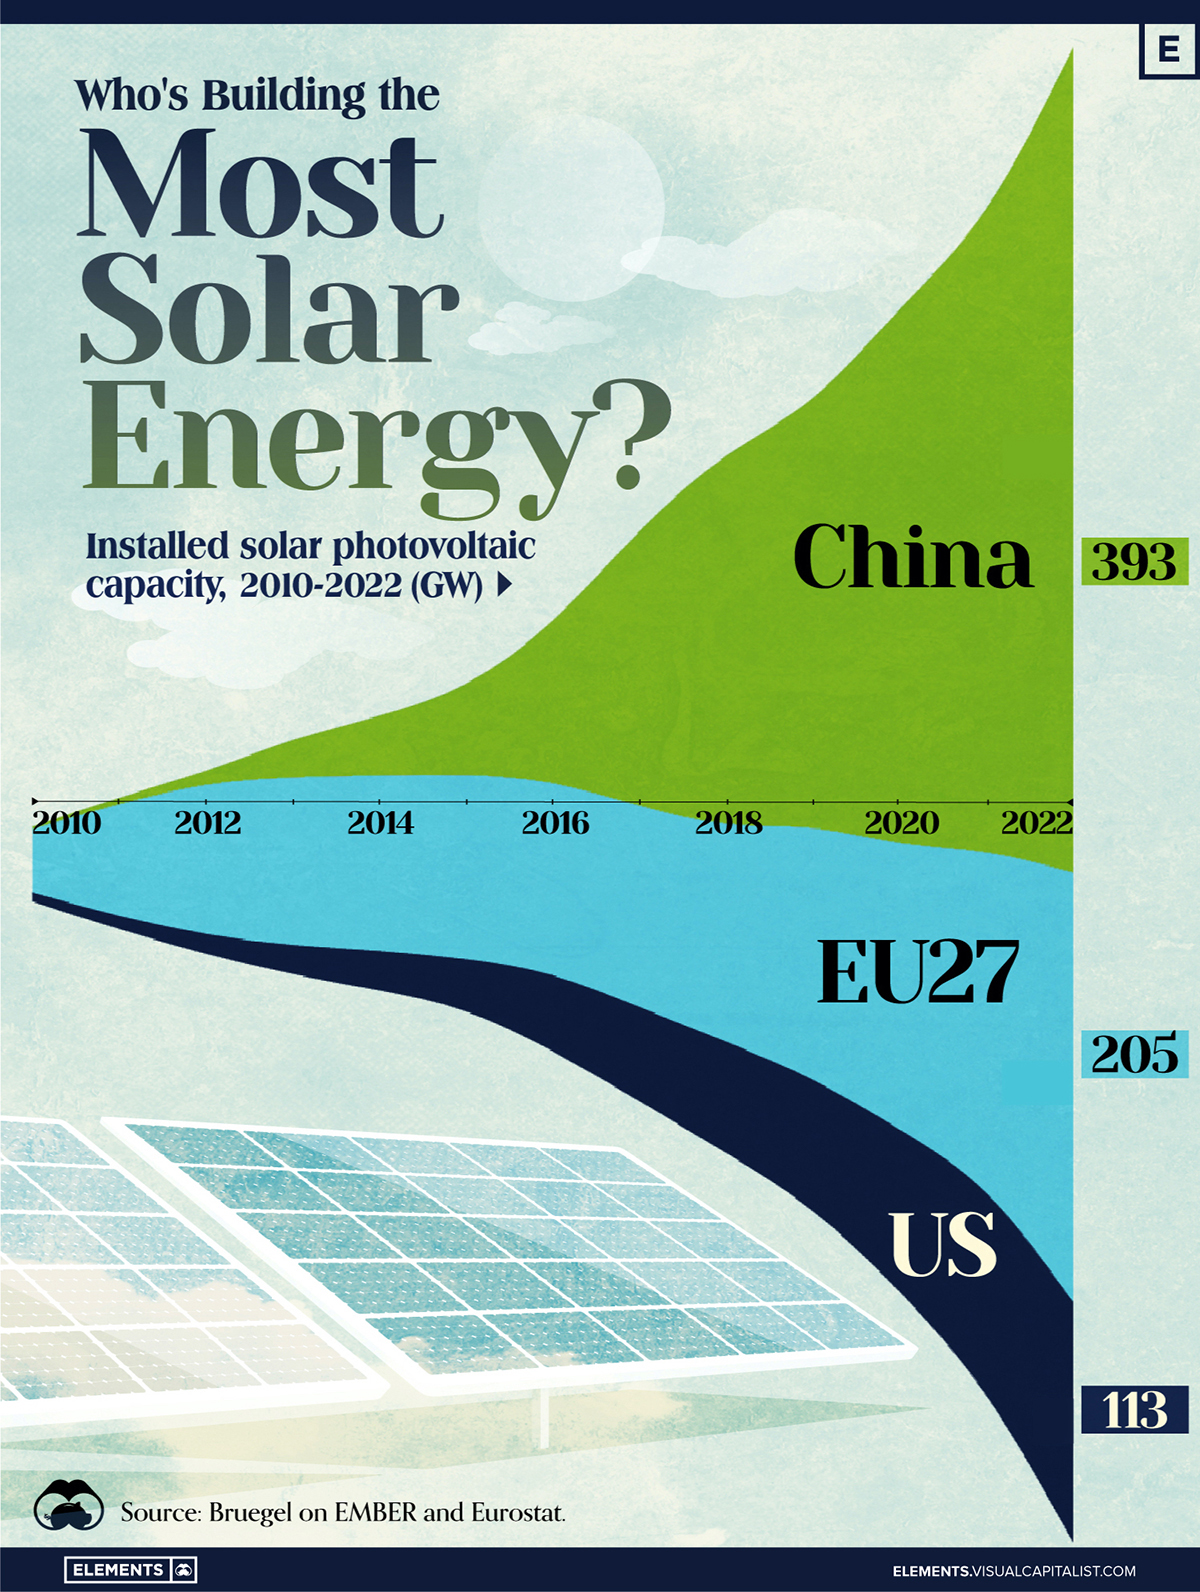
In this graphic, we illustrate the rise in installed solar photovoltaic (PV) capacity in China, the EU, and the U.S. between 2010 and 2022, measured in gigawatts (GW). Bruegel compiled the data..
Chinese Dominance
As of 2022, China’s total installed capacity stands at 393 GW, nearly double that of the EU’s 205 GW and surpassing the USA’s total of 113 GW by more than threefold in absolute terms.
| Installed solar capacity (GW) | China | EU27 | U.S. |
|---|---|---|---|
| 2022 | 393.0 | 205.5 | 113.0 |
| 2021 | 307.0 | 162.7 | 95.4 |
| 2020 | 254.0 | 136.9 | 76.4 |
| 2019 | 205.0 | 120.1 | 61.6 |
| 2018 | 175.3 | 104.0 | 52.0 |
| 2017 | 130.8 | 96.2 | 43.8 |
| 2016 | 77.8 | 91.5 | 35.4 |
| 2015 | 43.6 | 87.7 | 24.2 |
| 2014 | 28.4 | 83.6 | 18.1 |
| 2013 | 17.8 | 79.7 | 13.3 |
| 2012 | 6.7 | 71.1 | 8.6 |
| 2011 | 3.1 | 53.3 | 5.6 |
| 2010 | 1.0 | 30.6 | 3.4 |
Since 2017, China has shown a compound annual growth rate (CAGR) of approximately 25% in installed PV capacity, while the USA has seen a CAGR of 21%, and the EU of 16%.
Additionally, China dominates the production of solar power components, currently controlling around 80% of the world’s solar panel supply chain.
In 2022, China’s solar industry employed 2.76 million individuals, with manufacturing roles representing approximately 1.8 million and the remaining 918,000 jobs in construction, installation, and operations and maintenance.
The EU industry employed 648,000 individuals, while the U.S. reached 264,000 jobs.
According to the IEA, China accounts for almost 60% of new renewable capacity expected to become operational globally by 2028.
Despite the phasing out of national subsidies in 2020 and 2021, deployment of solar PV in China is accelerating. The country is expected to reach its national 2030 target for wind and solar PV installations in 2024, six years ahead of schedule.


Energy Shift
Visualizing Copper Production by Country in 2023
Chile and Peru account for one-third of the world’s copper output.


Visualizing Copper Production by Country in 2023
This was originally posted on our Voronoi app. Download the app for free on iOS or Android and discover incredible data-driven charts from a variety of trusted sources.
Copper is considered an essential metal for the clean energy transition because it is a great conductor of electricity.
As a result, governments around the world have been encouraging the construction of new mines, and mining companies have been seeking new projects and acquiring existing mines to meet the growing demand.
In this graphic, we illustrate global copper production in 2023, based on data from the U.S. Geological Survey, Mineral Commodity Summaries, as of January 2024.
Most Copper Comes from South America
Chile and Peru account for one-third of the world’s copper output.
| Country | Region | 2023E Production (Million tonnes) |
|---|---|---|
| 🇨🇱 Chile | South America | 5.0 |
| 🇵🇪 Peru | South America | 2.6 |
| 🇨🇩 Congo (Kinshasa) | Africa | 2.5 |
| 🇨🇳 China | Asia | 1.7 |
| 🇺🇸 United States | North America | 1.1 |
| 🇷🇺 Russia | Europe/Asia | 0.9 |
| 🇦🇺 Australia | Oceania | 0.8 |
| 🇮🇩 Indonesia | Asia | 0.8 |
| 🇿🇲 Zambia | Africa | 0.8 |
| 🇲🇽 Mexico | North America | 0.7 |
| 🇰🇿 Kazakhstan | Asia | 0.6 |
| 🇨🇦 Canada | North America | 0.5 |
| 🇵🇱 Poland | Europe | 0.4 |
| 🌍 Rest of World | -- | 3.1 |
| World total (rounded) | -- | 21.5 |
Chile is also home to the two largest mines in the world, Escondida and Collahuasi.
Meanwhile, African countries have rapidly increased their production. The Democratic Republic of Congo, for example, transitioned from being a secondary copper producer in the late 1990s to becoming the third-largest producer by 2023.
Part of the growth in copper mining in Africa is attributed to high investment from China. Chinese mining companies represent 8% of Africa’s total output in the mining sector.
Within its territory, China has also seen a 277% growth in copper production over the last three decades.
In the U.S., Arizona is the leading copper-producing state, accounting for approximately 70% of domestic output. Copper is also mined in Michigan, Missouri, Montana, Nevada, New Mexico, and Utah.
Energy Shift
The World’s Biggest Oil Producers in 2023
Just three countries accounted for 40% of global oil production last year.

The World’s Biggest Oil Producers in 2023
This was originally posted on our Voronoi app. Download the app for free on iOS or Android and discover incredible data-driven charts from a variety of trusted sources.
Despite efforts to decarbonize the global economy, oil still remains one of the world’s most important resources. It’s also produced by a fairly limited group of countries, which can be a source of economic and political leverage.
This graphic illustrates global crude oil production in 2023, measured in million barrels per day, sourced from the U.S. Energy Information Administration (EIA).
Three Countries Account for 40% of Global Oil Production
In 2023, the United States, Russia, and Saudi Arabia collectively contributed 32.7 million barrels per day to global oil production.
| Oil Production 2023 | Million barrels per day |
|---|---|
| 🇺🇸 U.S. | 12.9 |
| 🇷🇺 Russia | 10.1 |
| 🇸🇦 Saudi Arabia | 9.7 |
| 🇨🇦 Canada | 4.6 |
| 🇮🇶 Iraq | 4.3 |
| 🇨🇳 China | 4.2 |
| 🇮🇷 Iran | 3.6 |
| 🇧🇷 Brazil | 3.4 |
| 🇦🇪 UAE | 3.4 |
| 🇰🇼 Kuwait | 2.7 |
| 🌍 Other | 22.8 |
These three nations have consistently dominated oil production since 1971. The leading position, however, has alternated among them over the past five decades.
In contrast, the combined production of the next three largest producers—Canada, Iraq, and China—reached 13.1 million barrels per day in 2023, just surpassing the production of the United States alone.
In the near term, no country is likely to surpass the record production achieved by the U.S. in 2023, as no other producer has ever reached a daily capacity of 13.0 million barrels. Recently, Saudi Arabia’s state-owned Saudi Aramco scrapped plans to increase production capacity to 13.0 million barrels per day by 2027.
In 2024, analysts forecast that the U.S. will maintain its position as the top oil producer. In fact, according to Macquarie Group, U.S. oil production is expected to achieve a record pace of about 14 million barrels per day by the end of the year.

-

 Electrification3 years ago
Ranked: The Top 10 EV Battery Manufacturers
-

 Electrification2 years ago
The Key Minerals in an EV Battery
-

 Real Assets3 years ago
The World’s Top 10 Gold Mining Companies
-

 Electrification3 years ago
Mapped: Solar Power by Country in 2021
-

 Misc3 years ago
All the Metals We Mined in One Visualization
-

 Energy Shift2 years ago
What Are the Five Major Types of Renewable Energy?
-

 Electrification2 years ago
The World’s Largest Nickel Mining Companies
-

 Misc3 years ago
The Largest Copper Mines in the World by Capacity