

Energy Shift
Visualizing the Scale of Global Fossil Fuel Production
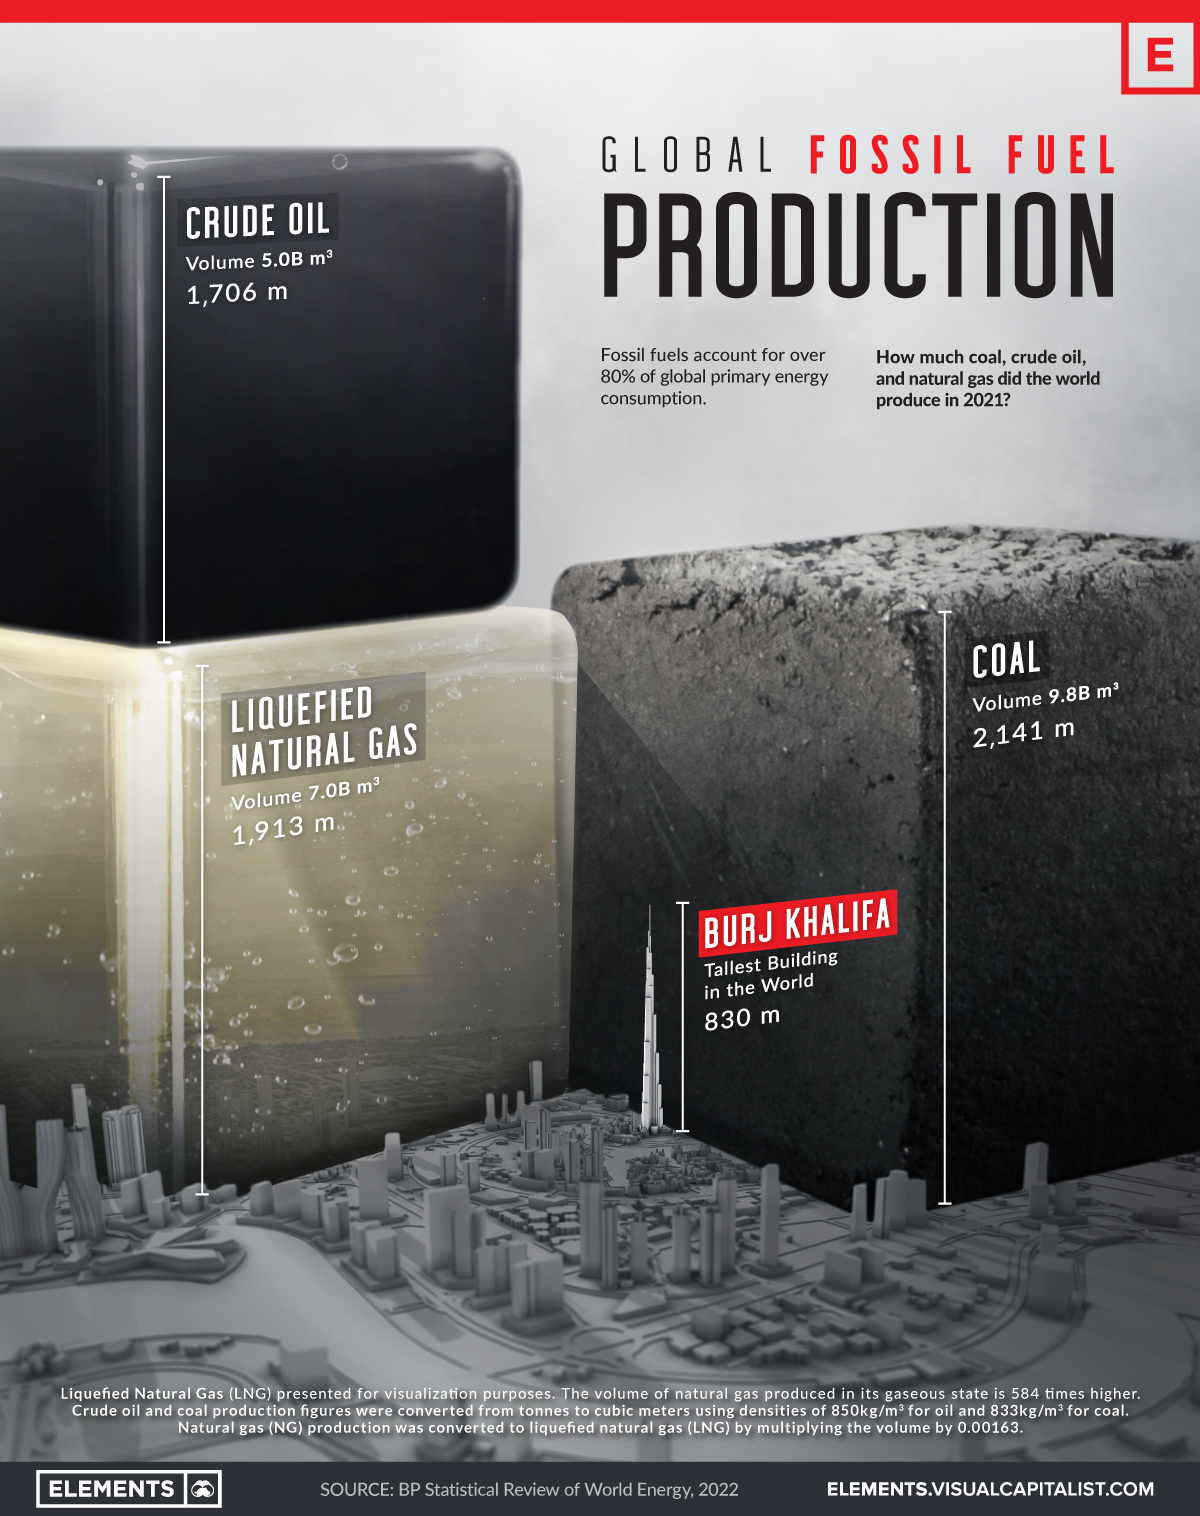


The Scale of Global Fossil Fuel Production
Fossil fuels have been our predominant source of energy for over a century, and the world still extracts and consumes a colossal amount of coal, oil, and gas every year.
This infographic visualizes the volume of global fossil fuel production in 2021 using data from BP’s Statistical Review of World Energy.
The Facts on Fossil Fuels
In 2021, the world produced around 8 billion tonnes of coal, 4 billion tonnes of oil, and over 4 trillion cubic meters of natural gas.
Most of the coal is used to generate electricity for our homes and offices and has a key role in steel production. Similarly, natural gas is a large source of electricity and heat for industries and buildings. Oil is primarily used by the transportation sector, in addition to petrochemical manufacturing, heating, and other end uses.
Here’s a full breakdown of coal, oil, and gas production by country in 2021.
Coal Production
If all the coal produced in 2021 were arranged in a cube, it would measure 2,141 meters (2.1km) on each side—more than 2.5 times the height of the world’s tallest building.
China produced 50% or more than four billion tonnes of the world’s coal in 2021. It’s also the largest consumer of coal, accounting for 54% of coal consumption in 2021.
| Rank | Country | 2021 Coal Production (million tonnes) | % of Total |
|---|---|---|---|
| #1 | 🇨🇳 China | 4,126.0 | 50% |
| #2 | 🇮🇳 India | 811.3 | 10% |
| #3 | 🇮🇩 Indonesia | 614.0 | 8% |
| #4 | 🇺🇸 U.S. | 524.4 | 6% |
| #5 | 🇦🇺 Australia | 478.6 | 6% |
| #6 | 🇷🇺 Russia | 433.7 | 5% |
| #7 | 🇿🇦 South Africa | 234.5 | 3% |
| #8 | 🇩🇪 Germany | 126.0 | 2% |
| #9 | 🇰🇿 Kazakhstan | 115.7 | 1% |
| #10 | 🇵🇱 Poland | 107.6 | 1% |
| 🌍 Other | 600.9 | 7% | |
| Total | 8,172.6 | 100% |
India is both the second largest producer and consumer of coal. Meanwhile, Indonesia is the world’s largest coal exporter, followed by Australia.
In the West, U.S. coal production was down 47% as compared to 2011 levels, and the descent is likely to continue with the clean energy transition.
Oil Production
In 2021, the United States, Russia, and Saudi Arabia were the three largest crude oil producers, respectively.
| Rank | Country | 2021 Oil Production (million tonnes) | % of Total |
|---|---|---|---|
| #1 | 🇺🇸 U.S. | 711.1 | 17% |
| #2 | 🇷🇺 Russia | 536.4 | 13% |
| #3 | 🇸🇦 Saudi Arabia | 515.0 | 12% |
| #4 | 🇨🇦 Canada | 267.1 | 6% |
| #5 | 🇮🇶 Iraq | 200.8 | 5% |
| #6 | 🇨🇳 China | 198.9 | 5% |
| #7 | 🇮🇷 Iran | 167.7 | 4% |
| #8 | 🇦🇪 UAE | 164.4 | 4% |
| #9 | 🇧🇷 Brazil | 156.8 | 4% |
| #10 | 🇰🇼 Kuwait | 131.1 | 3% |
| 🌍 Other | 1172.0 | 28% | |
| Total | 4221.4 | 100% |
OPEC countries, including Saudi Arabia, made up the largest share of production at 35% or 1.5 billion tonnes of oil.
U.S. oil production has seen significant growth since 2010. In 2021, the U.S. extracted 711 million tonnes of oil, more than double the 333 million tonnes produced in 2010.
Natural Gas Production
The world produced 4,036 billion cubic meters of natural gas in 2021. The above graphic converts that into an equivalent of seven billion cubic meters of liquefied natural gas (LNG) to visualize it on the same scale as oil and gas.
Here are the top 10 producers of natural gas in 2021:
| Rank | Country | 2021 Natural Gas Production (billion m3) | % of Total |
|---|---|---|---|
| #1 | 🇺🇸 U.S. | 934.2 | 23% |
| #2 | 🇷🇺 Russia | 701.7 | 17% |
| #3 | 🇮🇷 Iran | 256.7 | 6% |
| #4 | 🇨🇳 China | 209.2 | 5% |
| #5 | 🇶🇦 Qatar | 177.0 | 4% |
| #6 | 🇨🇦 Canada | 172.3 | 4% |
| #7 | 🇦🇺 Australia | 147.2 | 4% |
| #8 | 🇸🇦 Saudi Arabia | 117.3 | 3% |
| #9 | 🇳🇴 Norway | 114.3 | 3% |
| #10 | 🇩🇿 Algeria | 100.8 | 2% |
| 🌍 Other | 1106.3 | 27% | |
| Total | 4,036.9 | 100% |
The U.S. was the largest producer, with Texas and Pennsylvania accounting for 47% of its gas production. The U.S. electric power and industrial sectors account for around one-third of domestic natural gas consumption.
Russia, the next-largest producer, was the biggest exporter of gas in 2021. It exported an estimated 210 billion cubic meters of natural gas via pipelines to Europe and China. Around 80% of Russian natural gas comes from operations in the Arctic region.


Energy Shift
The World’s Biggest Oil Producers in 2023
Just three countries accounted for 40% of global oil production last year.

The World’s Biggest Oil Producers in 2023
This was originally posted on our Voronoi app. Download the app for free on iOS or Android and discover incredible data-driven charts from a variety of trusted sources.
Despite efforts to decarbonize the global economy, oil still remains one of the world’s most important resources. It’s also produced by a fairly limited group of countries, which can be a source of economic and political leverage.
This graphic illustrates global crude oil production in 2023, measured in million barrels per day, sourced from the U.S. Energy Information Administration (EIA).
Three Countries Account for 40% of Global Oil Production
In 2023, the United States, Russia, and Saudi Arabia collectively contributed 32.7 million barrels per day to global oil production.
| Oil Production 2023 | Million barrels per day |
|---|---|
| 🇺🇸 U.S. | 12.9 |
| 🇷🇺 Russia | 10.1 |
| 🇸🇦 Saudi Arabia | 9.7 |
| 🇨🇦 Canada | 4.6 |
| 🇮🇶 Iraq | 4.3 |
| 🇨🇳 China | 4.2 |
| 🇮🇷 Iran | 3.6 |
| 🇧🇷 Brazil | 3.4 |
| 🇦🇪 UAE | 3.4 |
| 🇰🇼 Kuwait | 2.7 |
| 🌍 Other | 22.8 |
These three nations have consistently dominated oil production since 1971. The leading position, however, has alternated among them over the past five decades.
In contrast, the combined production of the next three largest producers—Canada, Iraq, and China—reached 13.1 million barrels per day in 2023, just surpassing the production of the United States alone.
In the near term, no country is likely to surpass the record production achieved by the U.S. in 2023, as no other producer has ever reached a daily capacity of 13.0 million barrels. Recently, Saudi Arabia’s state-owned Saudi Aramco scrapped plans to increase production capacity to 13.0 million barrels per day by 2027.
In 2024, analysts forecast that the U.S. will maintain its position as the top oil producer. In fact, according to Macquarie Group, U.S. oil production is expected to achieve a record pace of about 14 million barrels per day by the end of the year.
Energy Shift
How Much Does the U.S. Depend on Russian Uranium?
Despite a new uranium ban being discussed in Congress, the U.S. is still heavily dependent on Russian uranium.

How Much Does the U.S. Depend on Russian Uranium?
This was originally posted on our Voronoi app. Download the app for free on iOS or Android and discover incredible data-driven charts from a variety of trusted sources.
The U.S. House of Representatives recently passed a ban on imports of Russian uranium. The bill must pass the Senate before becoming law.
In this graphic, we visualize how much the U.S. relies on Russian uranium, based on data from the United States Energy Information Administration (EIA).
U.S. Suppliers of Enriched Uranium
After Russia invaded Ukraine, the U.S. imposed sanctions on Russian-produced oil and gas—yet Russian-enriched uranium is still being imported.
Currently, Russia is the largest foreign supplier of nuclear power fuel to the United States. In 2022, Russia supplied almost a quarter of the enriched uranium used to fuel America’s fleet of more than 90 commercial reactors.
| Country of enrichment service | SWU* | % |
|---|---|---|
| 🇺🇸 United States | 3,876 | 27.34% |
| 🇷🇺 Russia | 3,409 | 24.04% |
| 🇩🇪 Germany | 1,763 | 12.40% |
| 🇬🇧 United Kingdom | 1,593 | 11.23% |
| 🇳🇱 Netherlands | 1,303 | 9.20% |
| Other | 2,232 | 15.79% |
| Total | 14,176 | 100% |
SWU stands for “Separative Work Unit” in the uranium industry. It is a measure of the amount of work required to separate isotopes of uranium during the enrichment process. Source: U.S. Energy Information Administration
Most of the remaining uranium is imported from European countries, while another portion is produced by a British-Dutch-German consortium operating in the United States called Urenco.
Similarly, nearly a dozen countries around the world depend on Russia for more than half of their enriched uranium—and many of them are NATO-allied members and allies of Ukraine.
In 2023 alone, the U.S. nuclear industry paid over $800 million to Russia’s state-owned nuclear energy corporation, Rosatom, and its fuel subsidiaries.
It is important to note that 19% of electricity in the U.S. is powered by nuclear plants.
The dependency on Russian fuels dates back to the 1990s when the United States turned away from its own enrichment capabilities in favor of using down-blended stocks of Soviet-era weapons-grade uranium.
As part of the new uranium-ban bill, the Biden administration plans to allocate $2.2 billion for the expansion of uranium enrichment facilities in the United States.

-

 Electrification3 years ago
Ranked: The Top 10 EV Battery Manufacturers
-

 Electrification2 years ago
The Key Minerals in an EV Battery
-

 Real Assets2 years ago
The World’s Top 10 Gold Mining Companies
-

 Misc3 years ago
All the Metals We Mined in One Visualization
-

 Electrification3 years ago
The Biggest Mining Companies in the World in 2021
-

 Energy Shift2 years ago
What Are the Five Major Types of Renewable Energy?
-

 Electrification2 years ago
The World’s Largest Nickel Mining Companies
-

 Electrification2 years ago
Mapped: Solar Power by Country in 2021