

Energy Shift
Mapped: Biggest Sources of Electricity by State and Province


Mapped: Biggest Sources of Electricity by State and Province
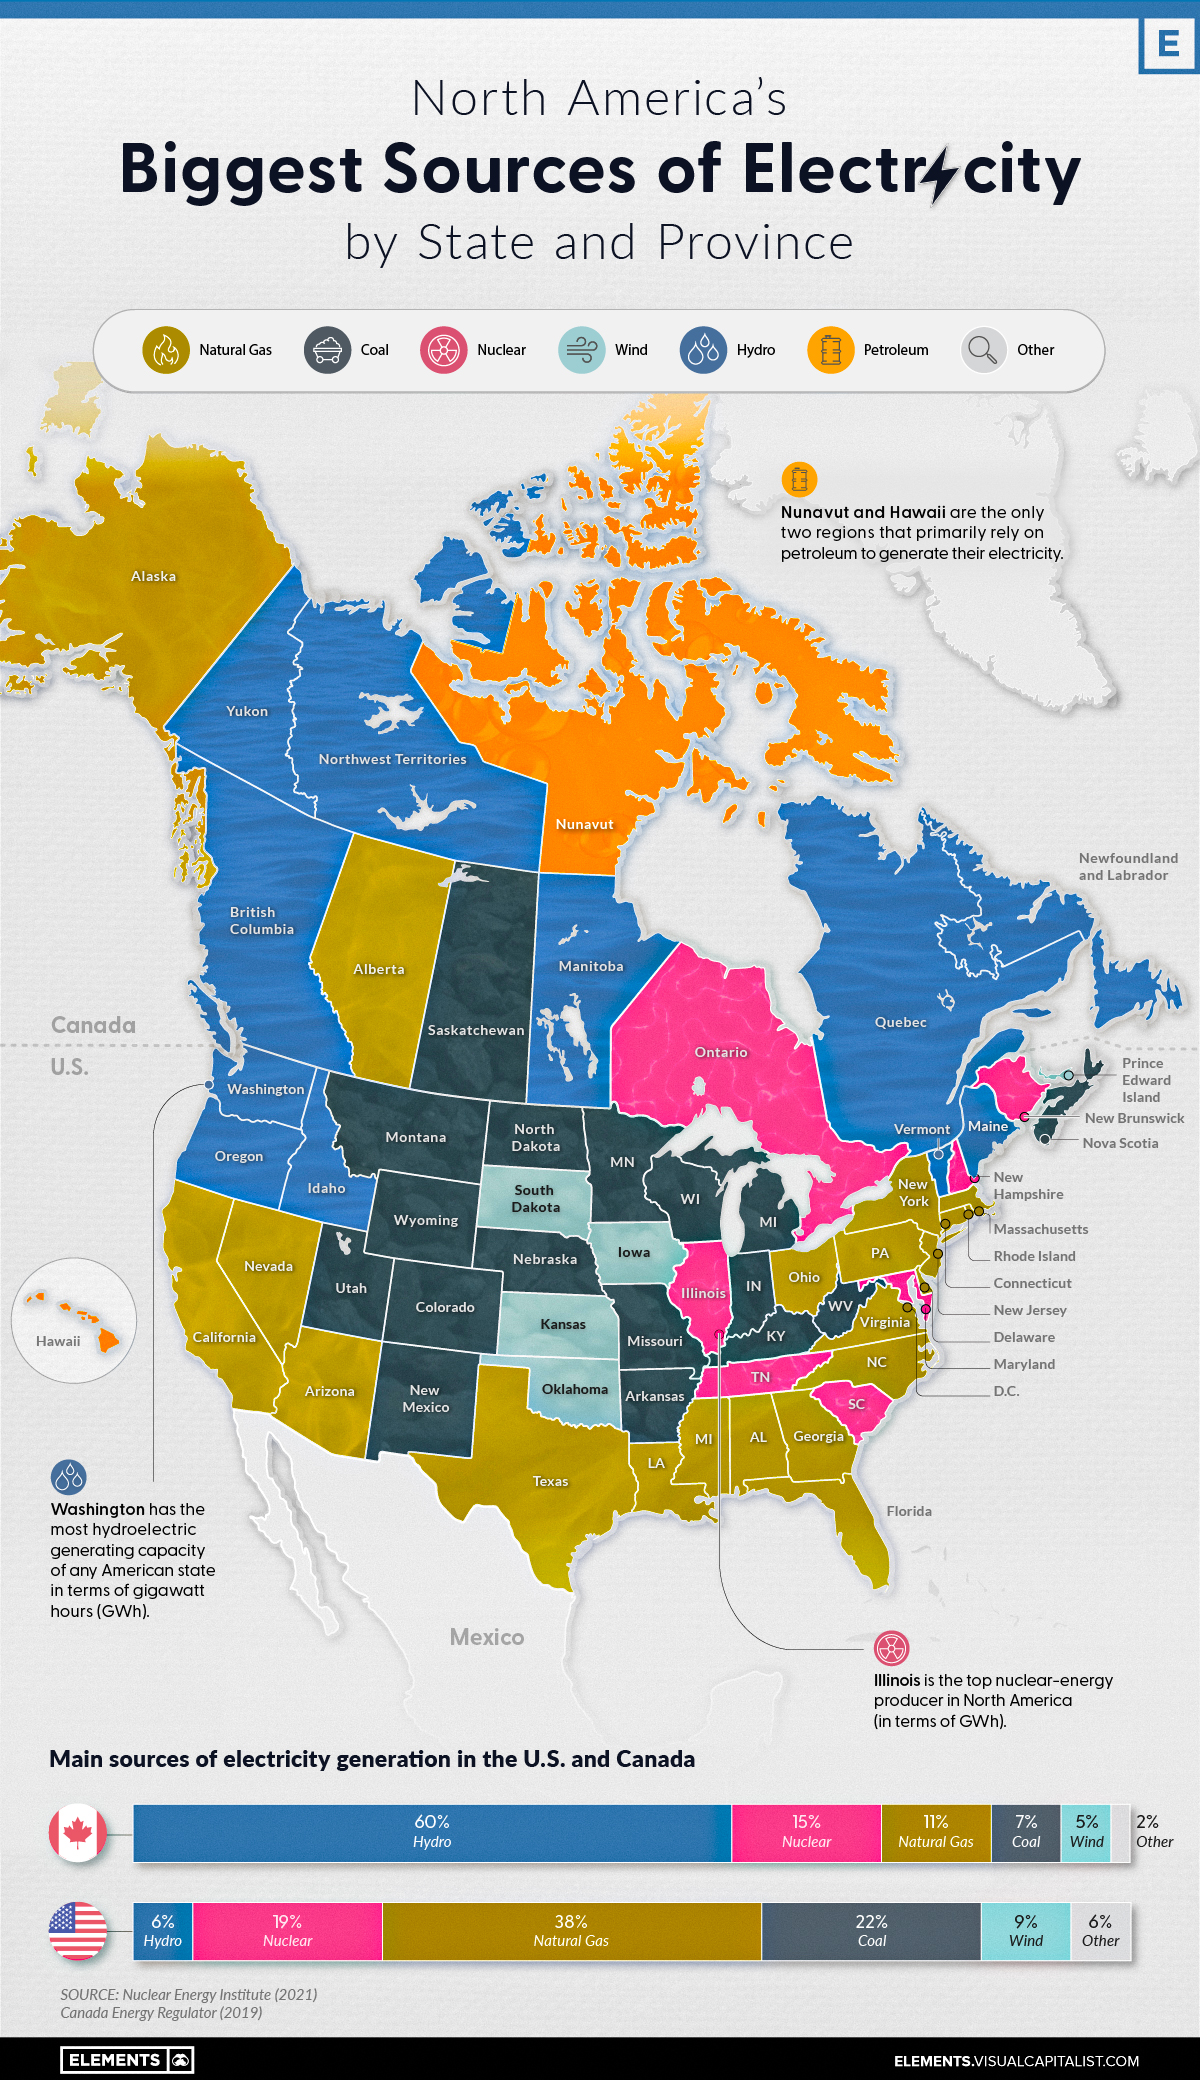
On a national scale, the United States and Canada rely on a very different makeup of sources to generate their electricity.
The U.S. primarily uses natural gas, coal, and nuclear power, while Canada relies on both hydro and nuclear. That said, when zooming in on the province or state level, individual primary electricity sources can differ greatly.
Here’s a look at the electricity generation in the states and provinces of these two countries using data from the Nuclear Energy Institute (2021) and the Canada Energy Regulator (2019).
Natural Gas
Natural gas is widely used for electricity generation in the United States. Known as a “cleaner” fossil fuel, its abundance, coupled with an established national distribution network and relatively low cost, makes it the leading electricity source in the country.
In 2021, 38% of the 4120 terawatt-hours (TWh) of electricity generated in the U.S. came from natural gas. Not surprisingly, more than 40% of American states have natural gas as their biggest electricity source.
Here are some states that have the largest shares of natural gas-sourced electricity.
| State/Province | % of Electricity from Natural Gas |
|---|---|
| 🇺🇸 Rhode Island | 90.9 |
| 🇺🇸 Delaware | 85.8 |
| 🇺🇸 Massachusetts | 76.9 |
| 🇺🇸 Florida | 73.9 |
| 🇺🇸 Mississippi | 72.1 |
In Canada, natural gas is only the third-biggest electricity source (behind hydro and nuclear), accounting for 11% of the 632 TWh of electricity produced in 2019. Alberta is the only province with natural gas as its main source of electricity.
Nuclear
Nuclear power is a carbon-free energy source that makes up a considerable share of the energy generated in both the U.S. and Canada.
19% of America’s and 15% of Canada’s electricity comes from nuclear power. While the percentages are close to one another, it’s good to note that the United States generates 6 to 7 times more electricity than Canada each year, yielding a lot more nuclear power than Canada in terms of gigawatt hours (GWh) per year.
As seen in the map, many states and provinces with nuclear as their main source of electricity are concentrated in the eastern half of the two countries.
In the U.S., Illinois, Pennsylvania, and South Carolina are top producers in terms of GWh/year. Illinois and South Carolina also have nuclear as their primary electricity source, whereas Pennsylvania’s electricity production from natural gas exceeds that from nuclear.
The vast majority of Canada’s nuclear reactors (18 of 19) are in Ontario, with the 19th in New Brunswick. Both of these provinces rely on nuclear as their biggest source of electricity.
Renewables: Hydro, Wind and Solar
Out of the different types of renewable electricity sources, hydro is the most prevalent in North America. For example, 60% of Canada’s and 6% of the U.S.’s electricity comes from hydropower.
Here are the states and provinces that have hydro as their biggest source of electricity.
| State/Province | % of Electricity from Hydro |
|---|---|
| 🇨🇦 Manitoba | 97 |
| 🇨🇦 Newfoundland and Labrador | 95 |
| 🇨🇦 Quebec | 94 |
| 🇨🇦 British Columbia | 87 |
| 🇨🇦 Yukon | 80 |
| 🇺🇸 Washington | 65 |
| 🇺🇸 Idaho | 51 |
| 🇺🇸 Vermont | 50 |
| 🇨🇦 Northwest Territories | 47 |
| 🇺🇸 Oregon | 46 |
Wind and solar power collectively comprise a small percentage of total electricity generated in both countries. While no state or province relies on solar as its biggest source of electricity, Iowa, Kansas, Oklahoma, and South Dakota rely primarily on wind for their electricity, along with Canada’s Prince Edward Island (PEI).
Coal and Oil
Coal and oil are emission-heavy electricity sources still prevalent in North America.
Currently, 22% of America’s and 7% of Canada’s electricity comes from coal, with places such as Kentucky, Missouri, West Virginia, Saskatchewan, and Nova Scotia still relying on coal as their biggest sources of electricity.
Certain regions also use petroleum to generate their electricity. Although its use for this purpose is declining, it is still the biggest source of electricity in both Hawaii and Nunavut.
Over the next few years, it will be interesting to observe the use of these fossil fuels for electricity generation in the U.S. and Canada. Despite the differences in climate commitments between the two countries, lowering coal and oil-related emissions may be a critical part of hitting decarbonization targets in a timely manner.


Energy Shift
Who’s Building the Most Solar Energy?
China’s solar capacity triples USA, nearly doubles EU.

Who’s Building the Most Solar Energy?
This was originally posted on our Voronoi app. Download the app for free on iOS or Android and discover incredible data-driven charts from a variety of trusted sources.
In 2023, solar energy accounted for three-quarters of renewable capacity additions worldwide. Most of this growth occurred in Asia, the EU, and the U.S., continuing a trend observed over the past decade.
In this graphic, we illustrate the rise in installed solar photovoltaic (PV) capacity in China, the EU, and the U.S. between 2010 and 2022, measured in gigawatts (GW). Bruegel compiled the data..
Chinese Dominance
As of 2022, China’s total installed capacity stands at 393 GW, nearly double that of the EU’s 205 GW and surpassing the USA’s total of 113 GW by more than threefold in absolute terms.
| Installed solar capacity (GW) | China | EU27 | U.S. |
|---|---|---|---|
| 2022 | 393.0 | 205.5 | 113.0 |
| 2021 | 307.0 | 162.7 | 95.4 |
| 2020 | 254.0 | 136.9 | 76.4 |
| 2019 | 205.0 | 120.1 | 61.6 |
| 2018 | 175.3 | 104.0 | 52.0 |
| 2017 | 130.8 | 96.2 | 43.8 |
| 2016 | 77.8 | 91.5 | 35.4 |
| 2015 | 43.6 | 87.7 | 24.2 |
| 2014 | 28.4 | 83.6 | 18.1 |
| 2013 | 17.8 | 79.7 | 13.3 |
| 2012 | 6.7 | 71.1 | 8.6 |
| 2011 | 3.1 | 53.3 | 5.6 |
| 2010 | 1.0 | 30.6 | 3.4 |
Since 2017, China has shown a compound annual growth rate (CAGR) of approximately 25% in installed PV capacity, while the USA has seen a CAGR of 21%, and the EU of 16%.
Additionally, China dominates the production of solar power components, currently controlling around 80% of the world’s solar panel supply chain.
In 2022, China’s solar industry employed 2.76 million individuals, with manufacturing roles representing approximately 1.8 million and the remaining 918,000 jobs in construction, installation, and operations and maintenance.
The EU industry employed 648,000 individuals, while the U.S. reached 264,000 jobs.
According to the IEA, China accounts for almost 60% of new renewable capacity expected to become operational globally by 2028.
Despite the phasing out of national subsidies in 2020 and 2021, deployment of solar PV in China is accelerating. The country is expected to reach its national 2030 target for wind and solar PV installations in 2024, six years ahead of schedule.
Energy Shift
The World’s Biggest Oil Producers in 2023
Just three countries accounted for 40% of global oil production last year.

The World’s Biggest Oil Producers in 2023
This was originally posted on our Voronoi app. Download the app for free on iOS or Android and discover incredible data-driven charts from a variety of trusted sources.
Despite efforts to decarbonize the global economy, oil still remains one of the world’s most important resources. It’s also produced by a fairly limited group of countries, which can be a source of economic and political leverage.
This graphic illustrates global crude oil production in 2023, measured in million barrels per day, sourced from the U.S. Energy Information Administration (EIA).
Three Countries Account for 40% of Global Oil Production
In 2023, the United States, Russia, and Saudi Arabia collectively contributed 32.7 million barrels per day to global oil production.
| Oil Production 2023 | Million barrels per day |
|---|---|
| 🇺🇸 U.S. | 12.9 |
| 🇷🇺 Russia | 10.1 |
| 🇸🇦 Saudi Arabia | 9.7 |
| 🇨🇦 Canada | 4.6 |
| 🇮🇶 Iraq | 4.3 |
| 🇨🇳 China | 4.2 |
| 🇮🇷 Iran | 3.6 |
| 🇧🇷 Brazil | 3.4 |
| 🇦🇪 UAE | 3.4 |
| 🇰🇼 Kuwait | 2.7 |
| 🌍 Other | 22.8 |
These three nations have consistently dominated oil production since 1971. The leading position, however, has alternated among them over the past five decades.
In contrast, the combined production of the next three largest producers—Canada, Iraq, and China—reached 13.1 million barrels per day in 2023, just surpassing the production of the United States alone.
In the near term, no country is likely to surpass the record production achieved by the U.S. in 2023, as no other producer has ever reached a daily capacity of 13.0 million barrels. Recently, Saudi Arabia’s state-owned Saudi Aramco scrapped plans to increase production capacity to 13.0 million barrels per day by 2027.
In 2024, analysts forecast that the U.S. will maintain its position as the top oil producer. In fact, according to Macquarie Group, U.S. oil production is expected to achieve a record pace of about 14 million barrels per day by the end of the year.

-

 Electrification3 years ago
Ranked: The Top 10 EV Battery Manufacturers
-

 Electrification2 years ago
The Key Minerals in an EV Battery
-

 Real Assets3 years ago
The World’s Top 10 Gold Mining Companies
-

 Misc3 years ago
All the Metals We Mined in One Visualization
-

 Energy Shift2 years ago
What Are the Five Major Types of Renewable Energy?
-

 Electrification2 years ago
Mapped: Solar Power by Country in 2021
-

 Electrification2 years ago
The World’s Largest Nickel Mining Companies
-

 Misc3 years ago
The Largest Copper Mines in the World by Capacity