

Energy Shift
Ranked: The World’s Top Cobalt Producing Countries


Ranked: The World’s Top Cobalt Producing Countries
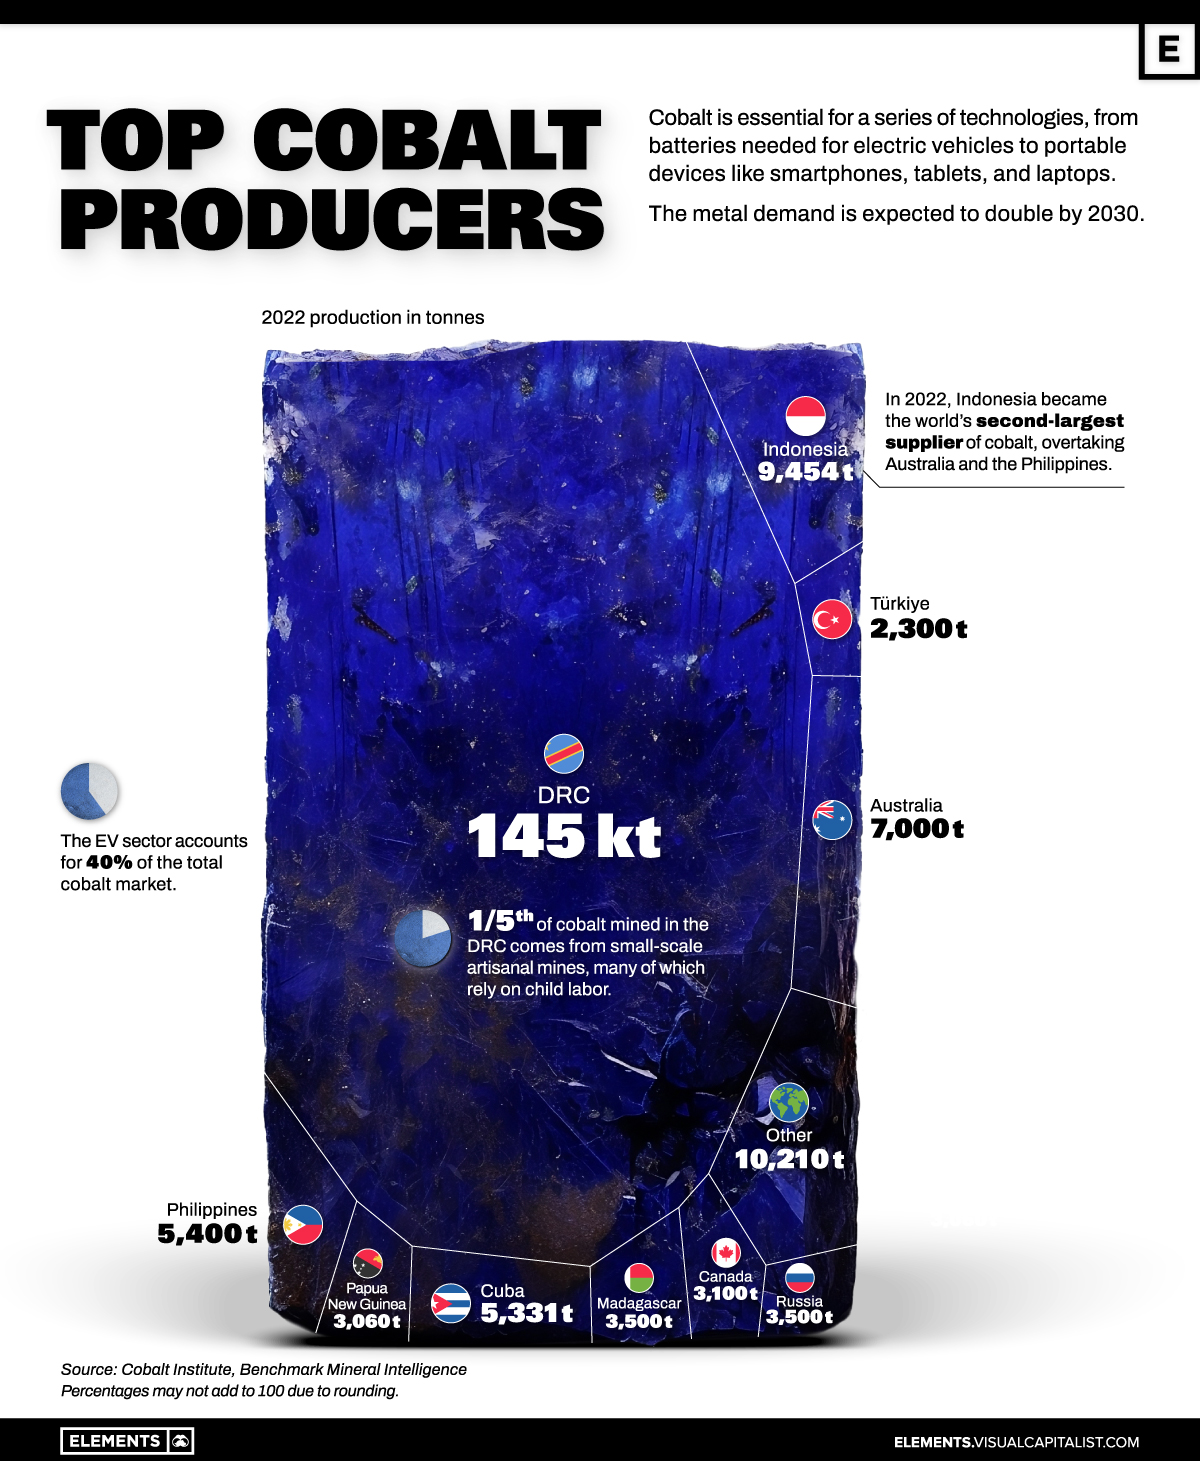
Cobalt, an essential component of key chemistries of the rechargeable lithium-ion batteries used in EVs, has seen a significant shift in its global production landscape.
The Democratic Republic of Congo (DRC) has long been the world’s largest cobalt producer, accounting for 73% of global output in 2022.
However, according to the Cobalt Institute, the DRC’s dominance is projected to decrease to 57% by 2030 as Indonesia ramps up its cobalt production as a byproduct from its rapidly expanding nickel industry.
Indonesia Became Second Largest Cobalt Producer in 2022
Indonesia accounts for nearly 5% of global cobalt production today, surpassing established producers like Australia and the Philippines.
In 2022, Indonesia’s cobalt production surged to almost 9,500 tonnes from 2,700 tonnes in 2021, with the potential to increase production by tenfold by 2030.
| Country | 2022 Production (tonnes) | % of Total Production |
|---|---|---|
| 🇨🇩 DRC | 144,936 | 73.3% |
| 🇮🇩 Indonesia | 9,454 | 4.8% |
| 🇦🇺 Australia | 7,000 | 3.5% |
| 🇵🇭 Philippines | 5,400 | 2.7% |
| 🇨🇺 Cuba | 5,331 | 2.7% |
| 🇷🇺 Russia | 3,500 | 1.8% |
| 🇲🇬 Madagascar | 3,500 | 1.8% |
| 🇨🇦 Canada | 3,100 | 1.6% |
| 🇵🇬 Papua New Guinea | 3,060 | 1.5% |
| 🇹🇷 Türkiye | 2,300 | 1.2% |
| 🌐 Other | 10,210 | 5.2% |
| Total | 197,791 | 100.0% |
Percentages may not add to 100 due to rounding.
In total, global cobalt production reached 197,791 tonnes, with the DRC contributing just under 145,000 tonnes of that mix.
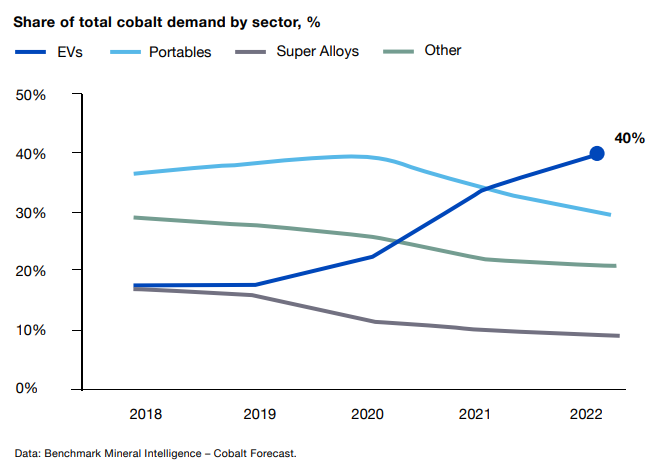
The EV industry is the largest consumer of cobalt, accounting for approximately 40% of total demand. The exponential growth of the EV sector is expected to drive a doubling of global cobalt demand by 2030.
While the shift in cobalt production is notable, it is not without challenges. Plummeting cobalt prices, which fell almost 30% this year to $13.90 a pound, have severely impacted the DRC.
Furthermore, the longer-term prospects of cobalt could face hurdles due to efforts to reduce its use in batteries, partly driven by human rights concerns associated with artisanal cobalt mining in the DRC and related child labor and human rights abuses.
In a 2021 ruling by a federal court in Washington, Google parent Alphabet, Apple, Dell, Microsoft, and Tesla were relieved from a class action suit claiming their responsibility for alleged child labor in Congolese cobalt mines.
The Future of Cobalt
Despite ongoing efforts to substitute cobalt in battery applications, cobalt is expected to remain a vital raw material for the entire battery supply chain in the near future.
The demand for cobalt is forecasted to more than double by 2030 to 388,000 tonnes.


Energy Shift
The World’s Biggest Oil Producers in 2023
Just three countries accounted for 40% of global oil production last year.

The World’s Biggest Oil Producers in 2023
This was originally posted on our Voronoi app. Download the app for free on iOS or Android and discover incredible data-driven charts from a variety of trusted sources.
Despite efforts to decarbonize the global economy, oil still remains one of the world’s most important resources. It’s also produced by a fairly limited group of countries, which can be a source of economic and political leverage.
This graphic illustrates global crude oil production in 2023, measured in million barrels per day, sourced from the U.S. Energy Information Administration (EIA).
Three Countries Account for 40% of Global Oil Production
In 2023, the United States, Russia, and Saudi Arabia collectively contributed 32.7 million barrels per day to global oil production.
| Oil Production 2023 | Million barrels per day |
|---|---|
| 🇺🇸 U.S. | 12.9 |
| 🇷🇺 Russia | 10.1 |
| 🇸🇦 Saudi Arabia | 9.7 |
| 🇨🇦 Canada | 4.6 |
| 🇮🇶 Iraq | 4.3 |
| 🇨🇳 China | 4.2 |
| 🇮🇷 Iran | 3.6 |
| 🇧🇷 Brazil | 3.4 |
| 🇦🇪 UAE | 3.4 |
| 🇰🇼 Kuwait | 2.7 |
| 🌍 Other | 22.8 |
These three nations have consistently dominated oil production since 1971. The leading position, however, has alternated among them over the past five decades.
In contrast, the combined production of the next three largest producers—Canada, Iraq, and China—reached 13.1 million barrels per day in 2023, just surpassing the production of the United States alone.
In the near term, no country is likely to surpass the record production achieved by the U.S. in 2023, as no other producer has ever reached a daily capacity of 13.0 million barrels. Recently, Saudi Arabia’s state-owned Saudi Aramco scrapped plans to increase production capacity to 13.0 million barrels per day by 2027.
In 2024, analysts forecast that the U.S. will maintain its position as the top oil producer. In fact, according to Macquarie Group, U.S. oil production is expected to achieve a record pace of about 14 million barrels per day by the end of the year.
Energy Shift
How Much Does the U.S. Depend on Russian Uranium?
Despite a new uranium ban being discussed in Congress, the U.S. is still heavily dependent on Russian uranium.

How Much Does the U.S. Depend on Russian Uranium?
This was originally posted on our Voronoi app. Download the app for free on iOS or Android and discover incredible data-driven charts from a variety of trusted sources.
The U.S. House of Representatives recently passed a ban on imports of Russian uranium. The bill must pass the Senate before becoming law.
In this graphic, we visualize how much the U.S. relies on Russian uranium, based on data from the United States Energy Information Administration (EIA).
U.S. Suppliers of Enriched Uranium
After Russia invaded Ukraine, the U.S. imposed sanctions on Russian-produced oil and gas—yet Russian-enriched uranium is still being imported.
Currently, Russia is the largest foreign supplier of nuclear power fuel to the United States. In 2022, Russia supplied almost a quarter of the enriched uranium used to fuel America’s fleet of more than 90 commercial reactors.
| Country of enrichment service | SWU* | % |
|---|---|---|
| 🇺🇸 United States | 3,876 | 27.34% |
| 🇷🇺 Russia | 3,409 | 24.04% |
| 🇩🇪 Germany | 1,763 | 12.40% |
| 🇬🇧 United Kingdom | 1,593 | 11.23% |
| 🇳🇱 Netherlands | 1,303 | 9.20% |
| Other | 2,232 | 15.79% |
| Total | 14,176 | 100% |
SWU stands for “Separative Work Unit” in the uranium industry. It is a measure of the amount of work required to separate isotopes of uranium during the enrichment process. Source: U.S. Energy Information Administration
Most of the remaining uranium is imported from European countries, while another portion is produced by a British-Dutch-German consortium operating in the United States called Urenco.
Similarly, nearly a dozen countries around the world depend on Russia for more than half of their enriched uranium—and many of them are NATO-allied members and allies of Ukraine.
In 2023 alone, the U.S. nuclear industry paid over $800 million to Russia’s state-owned nuclear energy corporation, Rosatom, and its fuel subsidiaries.
It is important to note that 19% of electricity in the U.S. is powered by nuclear plants.
The dependency on Russian fuels dates back to the 1990s when the United States turned away from its own enrichment capabilities in favor of using down-blended stocks of Soviet-era weapons-grade uranium.
As part of the new uranium-ban bill, the Biden administration plans to allocate $2.2 billion for the expansion of uranium enrichment facilities in the United States.

-

 Electrification3 years ago
Ranked: The Top 10 EV Battery Manufacturers
-

 Electrification2 years ago
The Key Minerals in an EV Battery
-

 Real Assets3 years ago
The World’s Top 10 Gold Mining Companies
-

 Misc3 years ago
All the Metals We Mined in One Visualization
-

 Electrification3 years ago
The Biggest Mining Companies in the World in 2021
-

 Energy Shift2 years ago
What Are the Five Major Types of Renewable Energy?
-

 Electrification2 years ago
Mapped: Solar Power by Country in 2021
-

 Electrification2 years ago
The World’s Largest Nickel Mining Companies