

Misc
Who’s Still Buying Fossil Fuels From Russia?
The Largest Importers of Russian Fossil Fuels Since the War
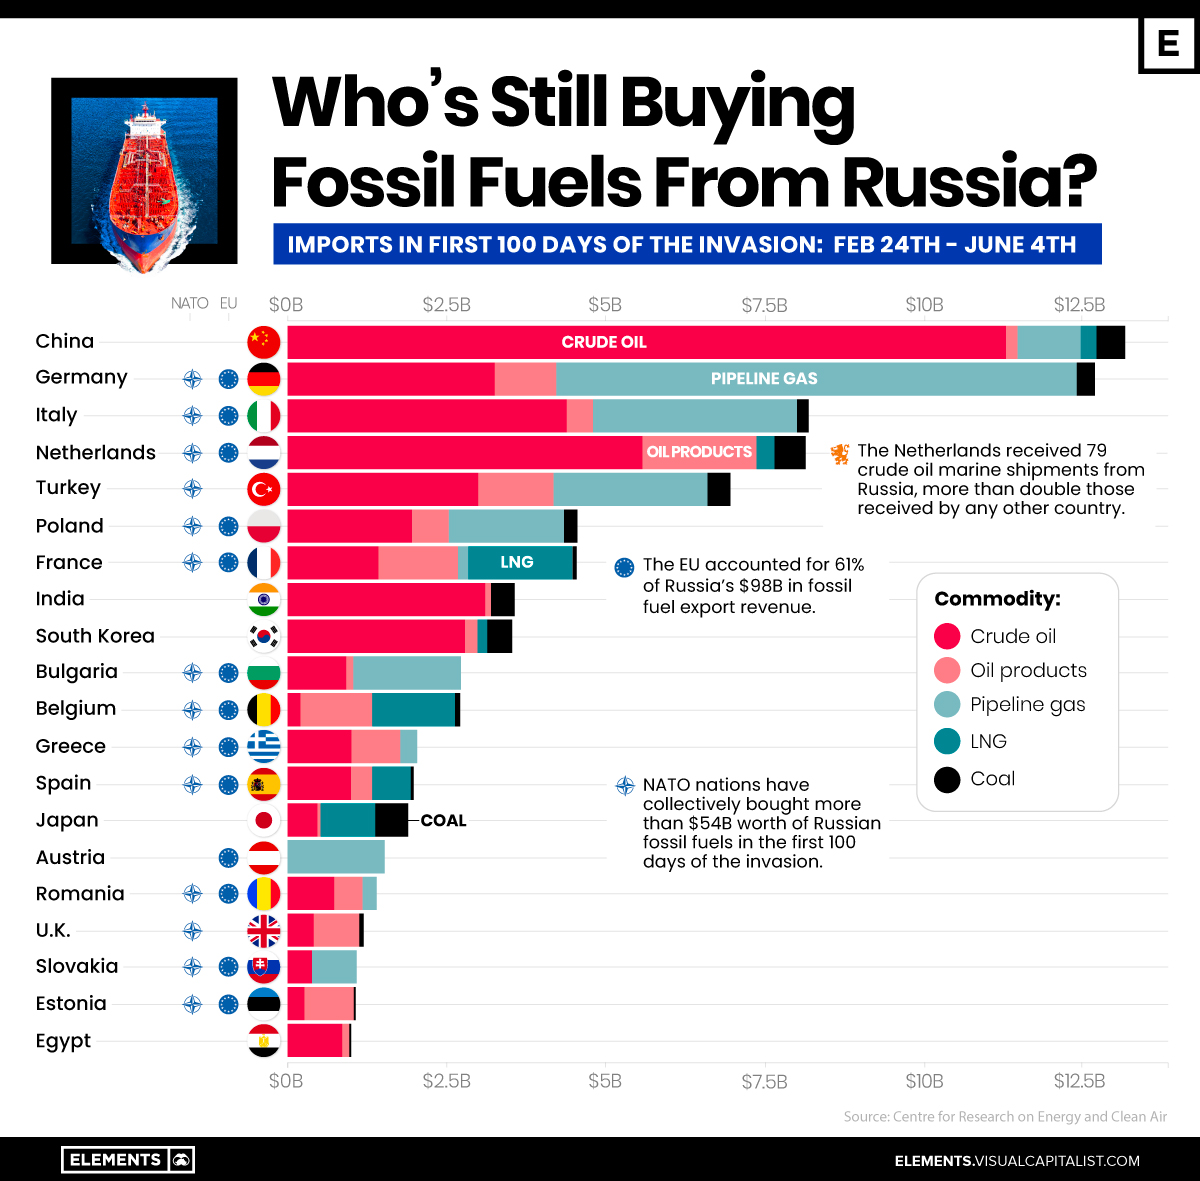
Despite looming sanctions and import bans, Russia exported $97.7 billion worth of fossil fuels in the first 100 days since its invasion of Ukraine, at an average of $977 million per day.
So, which fossil fuels are being exported by Russia, and who is importing these fuels?
The above infographic tracks the biggest importers of Russia’s fossil fuel exports during the first 100 days of the war based on data from the Centre for Research on Energy and Clean Air (CREA).
In Demand: Russia’s Black Gold
The global energy market has seen several cyclical shocks over the last few years.
The gradual decline in upstream oil and gas investment followed by pandemic-induced production cuts led to a drop in supply, while people consumed more energy as economies reopened and winters got colder. Consequently, fossil fuel demand was rising even before Russia’s invasion of Ukraine, which exacerbated the market shock.
Russia is the third-largest producer and second-largest exporter of crude oil. In the 100 days since the invasion, oil was by far Russia’s most valuable fossil fuel export, accounting for $48 billion or roughly half of the total export revenue.
| Fossil fuel | Revenue from exports (Feb 24 - June 4) | % of total Russian fossil fuel export revenue |
|---|---|---|
| Crude oil | $48.3B | 49.4% |
| Pipeline gas | $25.2B | 25.8% |
| Oil products | $13.6B | 13.9% |
| Liquified Natural Gas (LNG) | $5.4B | 5.5% |
| Coal | $5.0B | 5.1% |
| Total | $97.7B | 100% |
While Russian crude oil is shipped on tankers, a network of pipelines transports Russian gas to Europe. In fact, Russia accounts for 41% of all natural gas imports to the EU, and some countries are almost exclusively dependent on Russian gas. Of the $25 billion exported in pipeline gas, 85% went to the EU.
The Top Importers of Russian Fossil Fuels
The EU bloc accounted for 61% of Russia’s fossil fuel export revenue during the 100-day period.
Germany, Italy, and the Netherlands—members of both the EU and NATO—were among the largest importers, with only China surpassing them.
| Country | Value of fossil fuel imports from Russia (Feb 24 - June 4) | % of total Russian fossil fuel export revenue |
|---|---|---|
| China 🇨🇳 | $13.2B | 13.5% |
| Germany 🇩🇪 | $12.7B | 12.9% |
| Italy 🇮🇹 | $8.2B | 8.4% |
| Netherlands 🇳🇱 | $8.2B | 8.4% |
| Turkey 🇹🇷 | $7.0B | 7.2% |
| Poland 🇵🇱 | $4.6B | 4.7% |
| France 🇫🇷 | $4.5B | 4.6% |
| India 🇮🇳 | $3.6B | 3.7% |
| Other 🌍 | $35.7B | 36.5% |
| Total | $97.7B | 100% |
China overtook Germany as the largest importer, importing nearly 2 million barrels of discounted Russian oil per day in May—up 55% relative to a year ago. Similarly, Russia surpassed Saudi Arabia as China’s largest oil supplier.
The biggest increase in imports came from India, buying 18% of all Russian oil exports during the 100-day period. A significant amount of the oil that goes to India is re-exported as refined products to the U.S. and Europe, which are trying to become independent of Russian imports.
Reducing Reliance on Russia
In response to the invasion of Ukraine, several countries have taken strict action against Russia through sanctions on exports, including fossil fuels.
The U.S. and Sweden have banned Russian fossil fuel imports entirely, with monthly import volumes down 100% and 99% in May relative to when the invasion began, respectively.
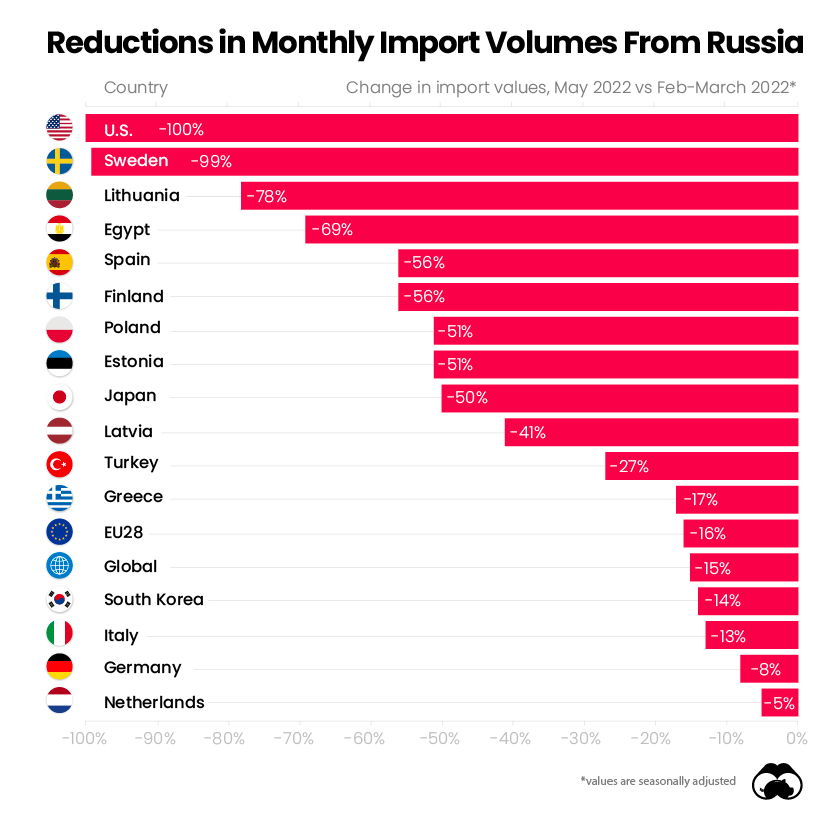
On a global scale, monthly fossil fuel import volumes from Russia were down 15% in May, an indication of the negative political sentiment surrounding the country.
It’s also worth noting that several European countries, including some of the largest importers over the 100-day period, have cut back on Russian fossil fuels. Besides the EU’s collective decision to reduce dependence on Russia, some countries have also refused the country’s ruble payment scheme, leading to a drop in imports.
The import curtailment is likely to continue. The EU recently adopted a sixth sanction package against Russia, placing a complete ban on all Russian seaborne crude oil products. The ban, which covers 90% of the EU’s oil imports from Russia, will likely realize its full impact after a six-to-eight month period that permits the execution of existing contracts.
While the EU is phasing out Russian oil, several European countries are heavily reliant on Russian gas. A full-fledged boycott on Russia’s fossil fuels would also hurt the European economy—therefore, the phase-out will likely be gradual, and subject to the changing geopolitical environment.


Misc
Visualizing Global Aluminum Production
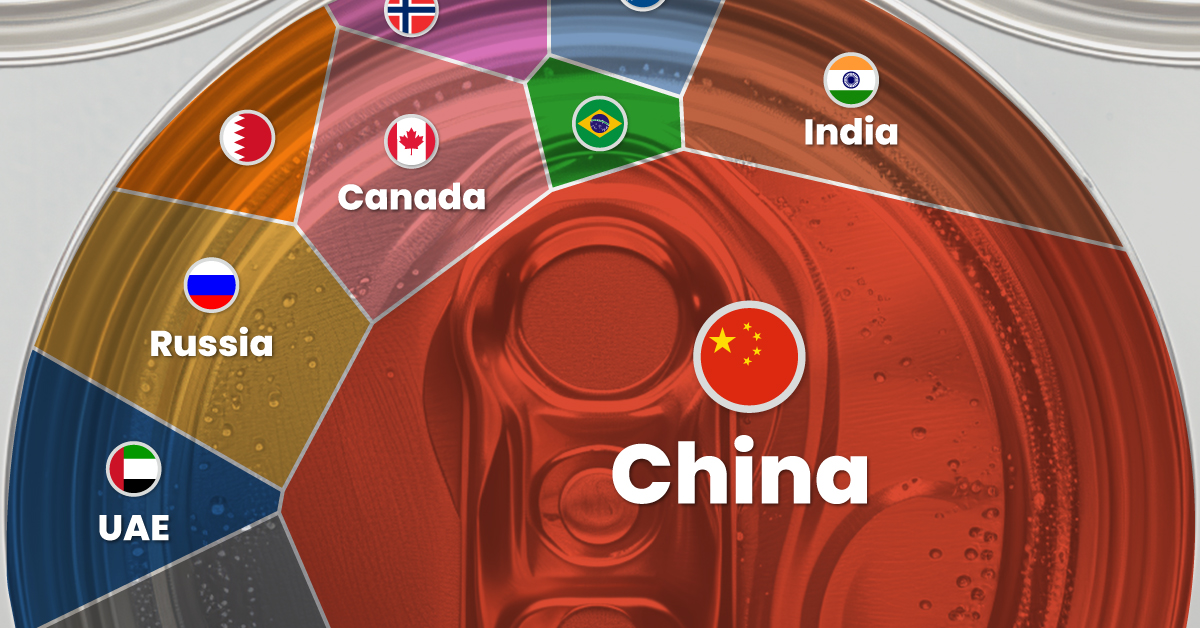
China dominates global production with nearly 60% share.
Visualizing Global Aluminum Production
This was originally posted on our Voronoi app. Download the app for free on iOS or Android and discover incredible data-driven charts from a variety of trusted sources.
This infographic shows estimated aluminum smelter production by country in 2023, based on data from the most recent U.S. Geological Survey (USGS) Mineral Commodity Summaries, published in January 2024 .
From this data, we can see that China leads as the top producer, accounting for nearly 60% of the world’s smelter capacity. Its neighbor India is the second-largest producer, making only a tenth of China’s output.
| Country | 2023 Aluminum Smelter Production (tonnes) | % of total |
|---|---|---|
| 🇨🇳 China | 41,000,000 | 59% |
| 🇮🇳 India | 4,100,000 | 6% |
| 🇷🇺 Russia | 3,800,000 | 5% |
| 🇨🇦 Canada | 3,000,000 | 4% |
| 🇦🇪 United Arab Emirates | 2,700,000 | 4% |
| 🇧🇭 Bahrain | 1,600,000 | 2% |
| 🇦🇺 Australia | 1,500,000 | 2% |
| 🇳🇴 Norway | 1,300,000 | 2% |
| 🇧🇷 Brazil | 1,100,000 | 2% |
| 🌍 Rest of the World | 9,460,000 | 14% |
| Total | 69,560,000 | 100% |
Responsible for 5% of global aluminum output, Russia has been targeted by recent sanctions from the U.S. and the UK.
The sanctions include prohibiting metal-trading exchanges from accepting new aluminum produced by Russia and barring the import of the Russian metal into the U.S. and Britain. The actions are aimed at disrupting Russian export revenue amid Moscow’s ongoing invasion of Ukraine.
The World’s Most Common Metal
Aluminum is the primary material used for making cans, foil, and many other products. It originates from bauxites, rocks composed of aluminum oxides, and various minerals.
Approximately 25% of annually produced aluminum is utilized by the construction industry, while another 23% is allocated to vehicle frames, wires, wheels, and other components within the transportation sector. Aluminum foil, cans, and packaging constitute another significant end-use category, accounting for 17% of consumption.
Despite its extensive use, aluminum is still plentiful. Aluminum is the world’s most common metal by crustal abundance, making up 8.2% of the Earth’s crust.
According to the USGS, global resources of bauxite are estimated to be between 55 billion and 75 billion tonnes and are sufficient to meet world demand for metal well into the future.
Misc
Brass Rods: The Sustainable Choice
Brass rods can help cut emissions in machine shops, be recycled without losing properties, and contribute to a cleaner environment.

Brass Rods: The Sustainable Choice
Brass rods have a powerful lineup of green attributes, making them the sustainable choice for manufacturers and end-users of precision machined and forged parts.
This infographic, from the Copper Development Association, shows how brass rods can reduce emissions in machine shops, be recycled without losing properties, and contribute to a cleaner environment.
The Brass Rod Circular Economy
The metallurgical properties of brass allow pre- and post-consumer sources of brass scrap to be recycled with no loss in properties.
Brass scrap can retain over 90% of the original material value. In addition, brass doesn’t need energy-intensive processing, unlike steel and aluminum, which must be smelted and refined before being recycled into new products.
As a result, there is a greater chance that steel and aluminum scrap will end up in landfills.
Most brass-rod alloys produced in North America contain 95% or higher recycled content.
Closed-loop recycling of brass keeps this valuable engineering material out of landfills, reducing the need for new mines and all the environmental impacts that entails.
Higher Machinability Leads to Lower Operational Carbon Emissions
Machinability is how easily a material can be worked using cutting processes. It directly impacts the amount of energy required to produce finished parts.
With typical machine shops producing millions of parts each year, the carbon impact can be significant.
Here’s how brass and steel compare when manufacturing complex parts using computer numerical control (CNC) machining.
| Material | Brass | Steel |
|---|---|---|
| Type | Free-cutting brass (C36000) | Free-cutting steel (12L14) |
| Maximum machinability rating (0-100) | 100 | 21 |
| Metal Removal Rate (cubic inches per minute) | 0.238 | 0.114 |
| Time to remove material (hours) | 161,111 | 336,111 |
| Energy required to produce parts (kilowatt-hour) | 9,475 | 18,931 |
In this example, using brass represented a savings of 3,510 kg in carbon dioxide (CO2).
The significantly longer tool life enabled by brass also reduces the need for new cutting tools, further decreasing emissions.
High recycled content and exceptional machinability make brass rods the sustainable choice for manufacturers and end-users seeking to reduce their environmental footprint and support the transition to a low-carbon future.
Explore the advantages of brass rod solutions.

-

 Electrification3 years ago
Ranked: The Top 10 EV Battery Manufacturers
-

 Electrification2 years ago
The Key Minerals in an EV Battery
-

 Real Assets3 years ago
The World’s Top 10 Gold Mining Companies
-

 Electrification2 years ago
Mapped: Solar Power by Country in 2021
-

 Misc3 years ago
All the Metals We Mined in One Visualization
-

 Energy Shift2 years ago
What Are the Five Major Types of Renewable Energy?
-

 Electrification2 years ago
The World’s Largest Nickel Mining Companies
-

 Misc3 years ago
The Largest Copper Mines in the World by Capacity