

Energy Shift
What is the Cost of Europe’s Energy Crisis?
What is the Cost of Europe’s Energy Crisis?
Europe is scrambling to cut its reliance on Russian fossil fuels.
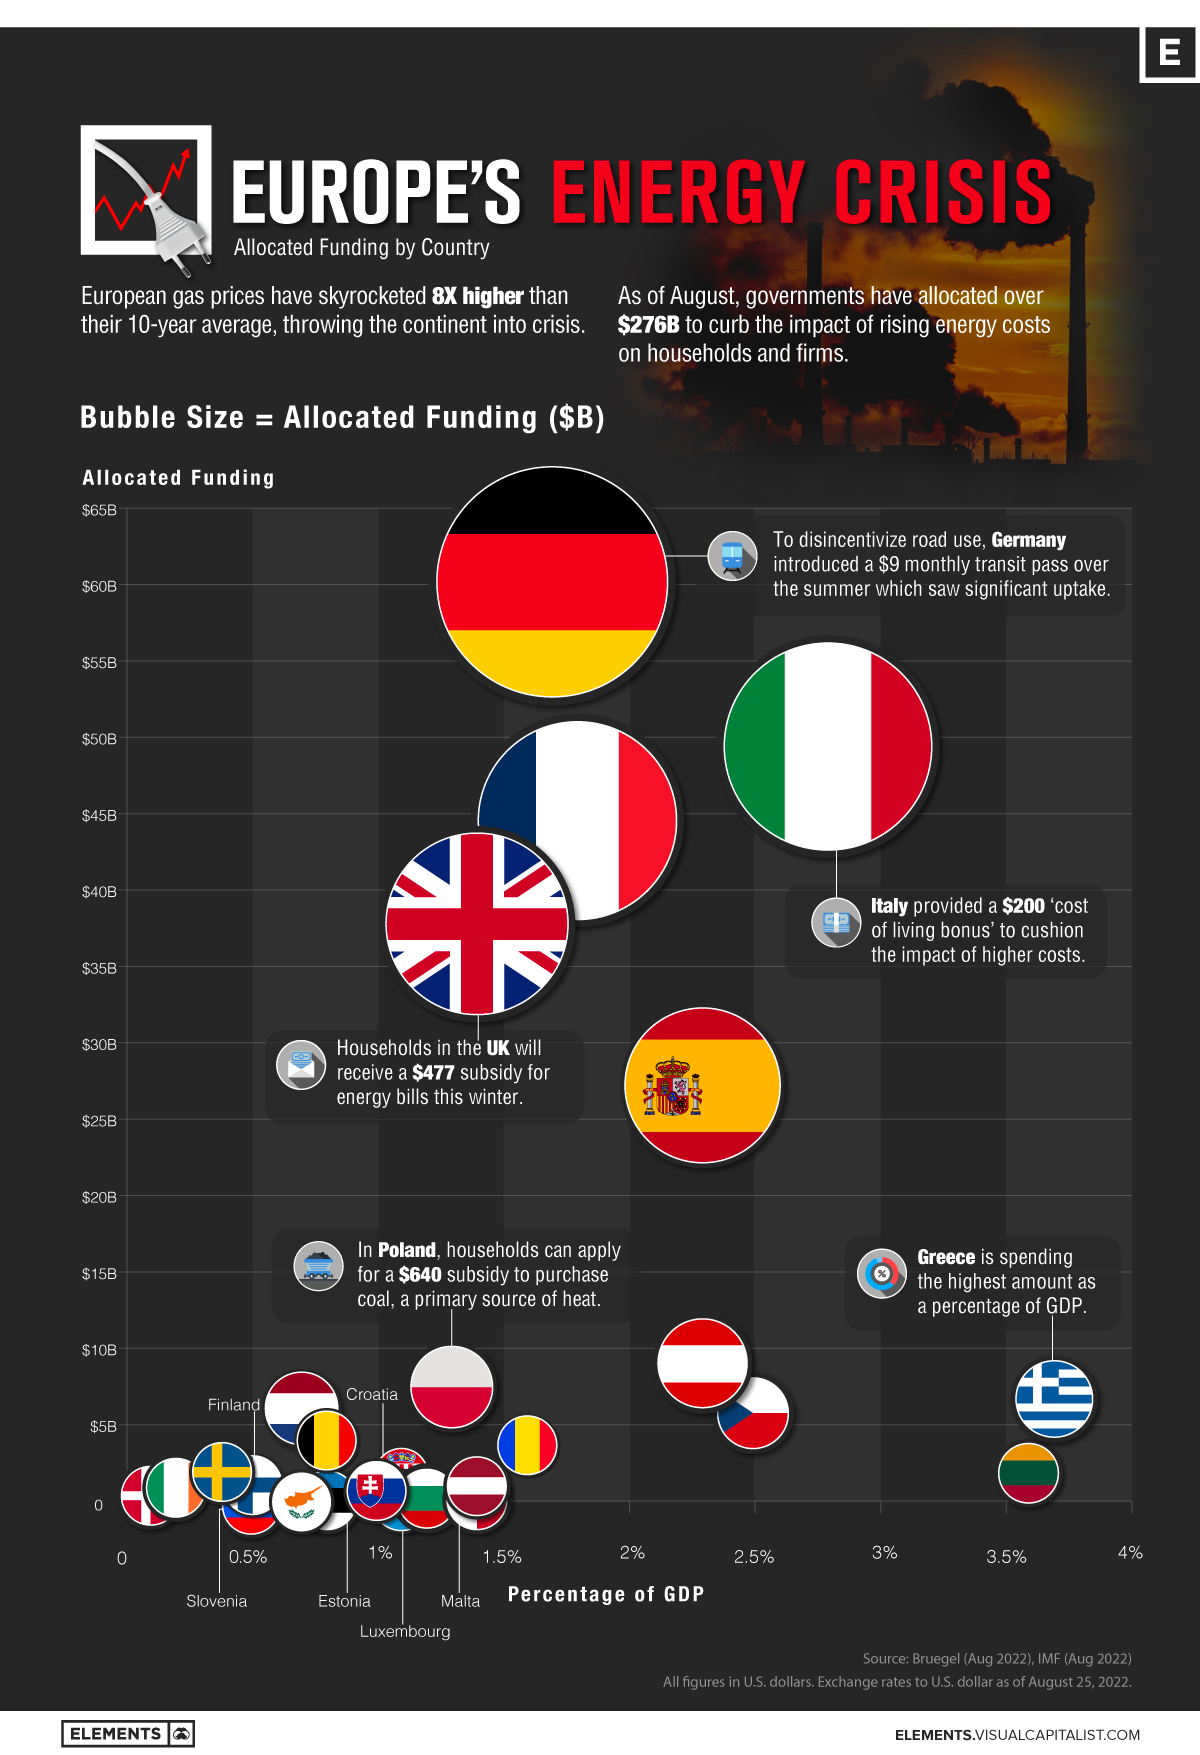
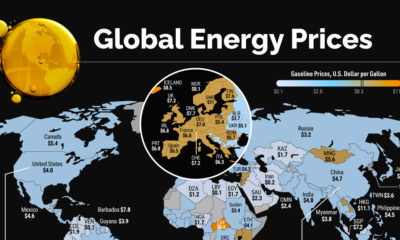
As European gas prices soar eight times their 10-year average, countries are introducing policies to curb the impact of rising prices on households and businesses. These include everything from the cost of living subsidies to wholesale price regulation. Overall, funding for such initiatives has reached $276 billion as of August.
With the continent thrown into uncertainty, the above chart shows allocated funding by country in response to the energy crisis.
The Energy Crisis, In Numbers
Using data from Bruegel, the below table reflects spending on national policies, regulation, and subsidies in response to the energy crisis for select European countries between September 2021 and July 2022. All figures in U.S. dollars.
| Country | Allocated Funding | Percentage of GDP | Household Energy Spending, Average Percentage |
|---|---|---|---|
| 🇩🇪 Germany | $60.2B | 1.7% | 9.9% |
| 🇮🇹 Italy | $49.5B | 2.8% | 10.3% |
| 🇫🇷 France | $44.7B | 1.8% | 8.5% |
| 🇬🇧 U.K. | $37.9B | 1.4% | 11.3% |
| 🇪🇸 Spain | $27.3B | 2.3% | 8.9% |
| 🇦🇹 Austria | $9.1B | 2.3% | 8.9% |
| 🇵🇱 Poland | $7.6B | 1.3% | 12.9% |
| 🇬🇷 Greece | $6.8B | 3.7% | 9.9% |
| 🇳🇱 Netherlands | $6.2B | 0.7% | 8.6% |
| 🇨🇿 Czech Republic | $5.9B | 2.5% | 16.1% |
| 🇧🇪 Belgium | $4.1B | 0.8% | 8.2% |
| 🇷🇴 Romania | $3.8B | 1.6% | 12.5% |
| 🇱🇹 Lithuania | $2.0B | 3.6% | 10.0% |
| 🇸🇪 Sweden | $1.9B | 0.4% | 9.2% |
| 🇫🇮 Finland | $1.2B | 0.5% | 6.1% |
| 🇸🇰 Slovakia | $1.0B | 1.0% | 14.0% |
| 🇮🇪 Ireland | $1.0B | 0.2% | 9.2% |
| 🇧🇬 Bulgaria | $0.8B | 1.2% | 11.2% |
| 🇱🇺 Luxembourg | $0.8B | 1.1% | n/a |
| 🇭🇷 Croatia | $0.6B | 1.1% | 14.3% |
| 🇱🇻 Lativia | $0.5B | 1.4% | 11.6% |
| 🇩🇰 Denmark | $0.5B | 0.1% | 8.2% |
| 🇸🇮 Slovenia | $0.3B | 0.5% | 10.4% |
| 🇲🇹 Malta | $0.2B | 1.4% | n/a |
| 🇪🇪 Estonia | $0.2B | 0.8% | 10.9% |
| 🇨🇾 Cyprus | $0.1B | 0.7% | n/a |
Source: Bruegel, IMF. Euro and pound sterling exchange rates to U.S. dollar as of August 25, 2022.
Germany is spending over $60 billion to combat rising energy prices. Key measures include a $300 one-off energy allowance for workers, in addition to $147 million in funding for low-income families. Still, energy costs are forecasted to increase by an additional $500 this year for households.
In Italy, workers and pensioners will receive a $200 cost of living bonus. Additional measures, such as tax credits for industries with high energy usage were introduced, including a $800 million fund for the automotive sector.
With energy bills predicted to increase three-fold over the winter, households in the U.K. will receive a $477 subsidy in the winter to help cover electricity costs.
Meanwhile, many Eastern European countries—whose households spend a higher percentage of their income on energy costs— are spending more on the energy crisis as a percentage of GDP. Greece is spending the highest, at 3.7% of GDP.
Utility Bailouts
Energy crisis spending is also extending to massive utility bailouts.
Uniper, a German utility firm, received $15 billion in support, with the government acquiring a 30% stake in the company. It is one of the largest bailouts in the country’s history. Since the initial bailout, Uniper has requested an additional $4 billion in funding.
Not only that, Wien Energie, Austria’s largest energy company, received a €2 billion line of credit as electricity prices have skyrocketed.
Deepening Crisis
Is this the tip of the iceberg? To offset the impact of high gas prices, European ministers are discussing even more tools throughout September in response to a threatening energy crisis.
To reign in the impact of high gas prices on the price of power, European leaders are considering a price ceiling on Russian gas imports and temporary price caps on gas used for generating electricity, among others.
Price caps on renewables and nuclear were also suggested.
Given the depth of the situation, the chief executive of Shell said that the energy crisis in Europe would extend beyond this winter, if not for several years.


Energy Shift
The World’s Biggest Oil Producers in 2023
Just three countries accounted for 40% of global oil production last year.

The World’s Biggest Oil Producers in 2023
This was originally posted on our Voronoi app. Download the app for free on iOS or Android and discover incredible data-driven charts from a variety of trusted sources.
Despite efforts to decarbonize the global economy, oil still remains one of the world’s most important resources. It’s also produced by a fairly limited group of countries, which can be a source of economic and political leverage.
This graphic illustrates global crude oil production in 2023, measured in million barrels per day, sourced from the U.S. Energy Information Administration (EIA).
Three Countries Account for 40% of Global Oil Production
In 2023, the United States, Russia, and Saudi Arabia collectively contributed 32.7 million barrels per day to global oil production.
| Oil Production 2023 | Million barrels per day |
|---|---|
| 🇺🇸 U.S. | 12.9 |
| 🇷🇺 Russia | 10.1 |
| 🇸🇦 Saudi Arabia | 9.7 |
| 🇨🇦 Canada | 4.6 |
| 🇮🇶 Iraq | 4.3 |
| 🇨🇳 China | 4.2 |
| 🇮🇷 Iran | 3.6 |
| 🇧🇷 Brazil | 3.4 |
| 🇦🇪 UAE | 3.4 |
| 🇰🇼 Kuwait | 2.7 |
| 🌍 Other | 22.8 |
These three nations have consistently dominated oil production since 1971. The leading position, however, has alternated among them over the past five decades.
In contrast, the combined production of the next three largest producers—Canada, Iraq, and China—reached 13.1 million barrels per day in 2023, just surpassing the production of the United States alone.
In the near term, no country is likely to surpass the record production achieved by the U.S. in 2023, as no other producer has ever reached a daily capacity of 13.0 million barrels. Recently, Saudi Arabia’s state-owned Saudi Aramco scrapped plans to increase production capacity to 13.0 million barrels per day by 2027.
In 2024, analysts forecast that the U.S. will maintain its position as the top oil producer. In fact, according to Macquarie Group, U.S. oil production is expected to achieve a record pace of about 14 million barrels per day by the end of the year.
Energy Shift
How Much Does the U.S. Depend on Russian Uranium?
Despite a new uranium ban being discussed in Congress, the U.S. is still heavily dependent on Russian uranium.

How Much Does the U.S. Depend on Russian Uranium?
This was originally posted on our Voronoi app. Download the app for free on iOS or Android and discover incredible data-driven charts from a variety of trusted sources.
The U.S. House of Representatives recently passed a ban on imports of Russian uranium. The bill must pass the Senate before becoming law.
In this graphic, we visualize how much the U.S. relies on Russian uranium, based on data from the United States Energy Information Administration (EIA).
U.S. Suppliers of Enriched Uranium
After Russia invaded Ukraine, the U.S. imposed sanctions on Russian-produced oil and gas—yet Russian-enriched uranium is still being imported.
Currently, Russia is the largest foreign supplier of nuclear power fuel to the United States. In 2022, Russia supplied almost a quarter of the enriched uranium used to fuel America’s fleet of more than 90 commercial reactors.
| Country of enrichment service | SWU* | % |
|---|---|---|
| 🇺🇸 United States | 3,876 | 27.34% |
| 🇷🇺 Russia | 3,409 | 24.04% |
| 🇩🇪 Germany | 1,763 | 12.40% |
| 🇬🇧 United Kingdom | 1,593 | 11.23% |
| 🇳🇱 Netherlands | 1,303 | 9.20% |
| Other | 2,232 | 15.79% |
| Total | 14,176 | 100% |
SWU stands for “Separative Work Unit” in the uranium industry. It is a measure of the amount of work required to separate isotopes of uranium during the enrichment process. Source: U.S. Energy Information Administration
Most of the remaining uranium is imported from European countries, while another portion is produced by a British-Dutch-German consortium operating in the United States called Urenco.
Similarly, nearly a dozen countries around the world depend on Russia for more than half of their enriched uranium—and many of them are NATO-allied members and allies of Ukraine.
In 2023 alone, the U.S. nuclear industry paid over $800 million to Russia’s state-owned nuclear energy corporation, Rosatom, and its fuel subsidiaries.
It is important to note that 19% of electricity in the U.S. is powered by nuclear plants.
The dependency on Russian fuels dates back to the 1990s when the United States turned away from its own enrichment capabilities in favor of using down-blended stocks of Soviet-era weapons-grade uranium.
As part of the new uranium-ban bill, the Biden administration plans to allocate $2.2 billion for the expansion of uranium enrichment facilities in the United States.

-

 Electrification3 years ago
Ranked: The Top 10 EV Battery Manufacturers
-

 Electrification2 years ago
The Key Minerals in an EV Battery
-

 Real Assets3 years ago
The World’s Top 10 Gold Mining Companies
-

 Misc3 years ago
All the Metals We Mined in One Visualization
-

 Electrification3 years ago
The Biggest Mining Companies in the World in 2021
-

 Energy Shift2 years ago
What Are the Five Major Types of Renewable Energy?
-

 Electrification2 years ago
Mapped: Solar Power by Country in 2021
-

 Electrification2 years ago
The World’s Largest Nickel Mining Companies