

Energy Shift
Mapped: Nuclear Reactors in the U.S.
View the full resolution version of this graphic.
Mapped: Nuclear Reactors in the U.S.
The United States is the world’s largest producer of nuclear power, representing more than 30% of the world’s nuclear power generation.
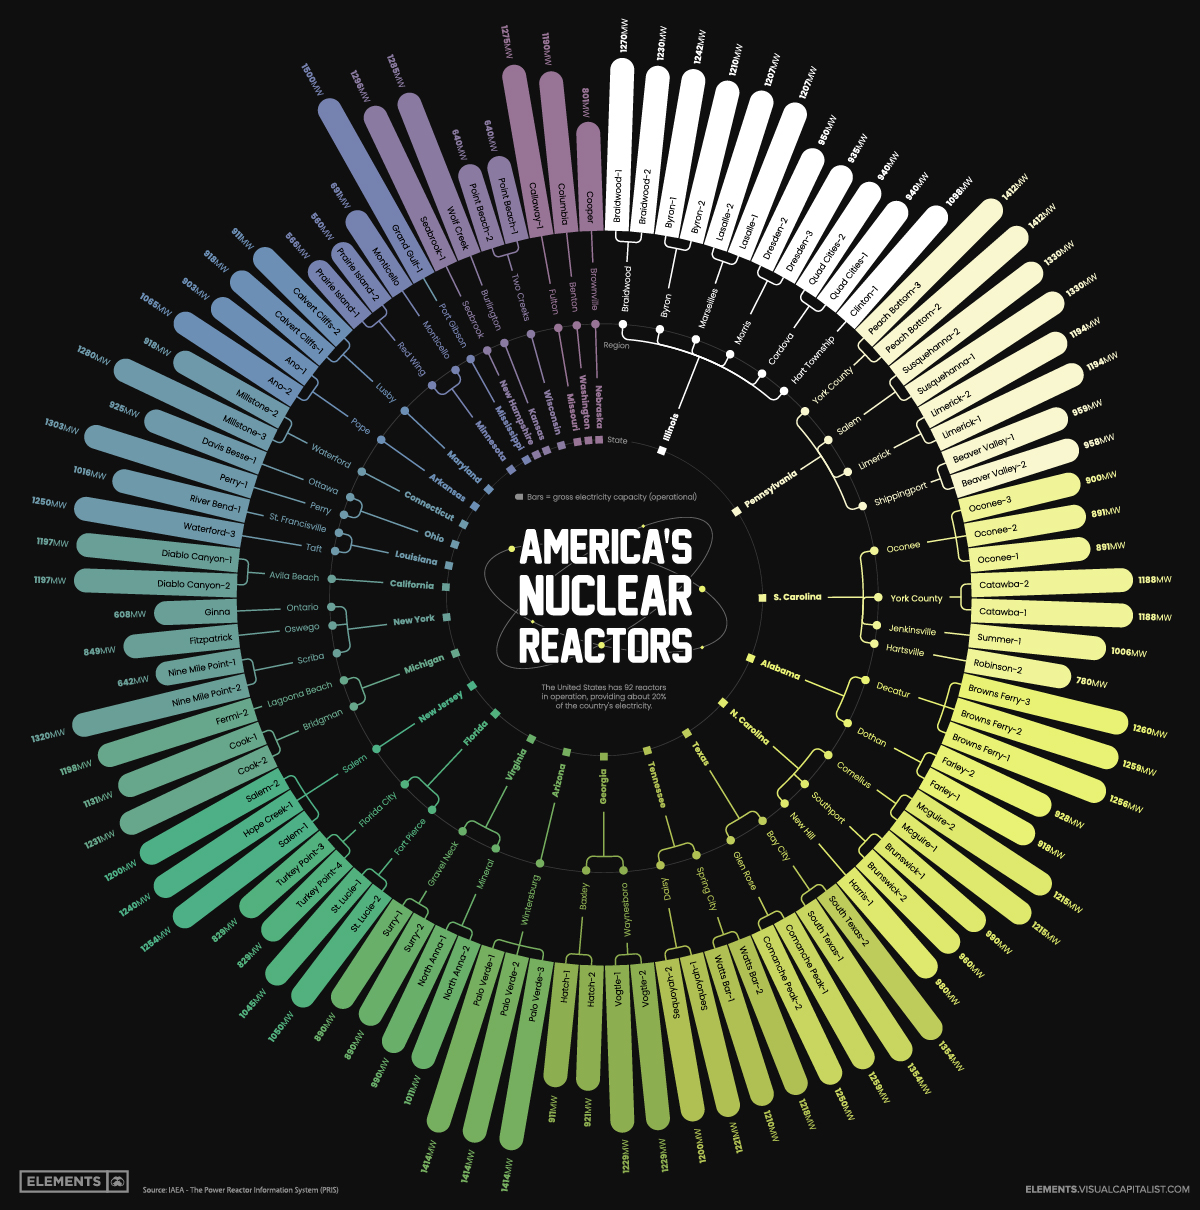
America has 92 reactors in operation, providing about 20% of the country’s electricity.
The above infographic uses data from the International Atomic Energy Agency to showcase every single nuclear reactor in America.
Nuclear Development
Nuclear power in the U.S. dates back to the 1950s.
George Westinghouse produced the first commercial pressurized water reactor in 1957 in Shippingport, Pennsylvania. The technology is used in approximately half of the 450 nuclear power reactors worldwide.
Today, over 30 different power companies across 30 states operate nuclear facilities in the U.S., and most nuclear power reactors are located east of the Mississippi River.
Illinois has more reactors than any state, with 11 reactors and the largest total nuclear electricity generation capacity at about 11,582 megawatts (MW). Meanwhile, the largest reactor is at the Grand Gulf Nuclear Station in Port Gibson, Mississippi, with a capacity of about 1,500 MW.
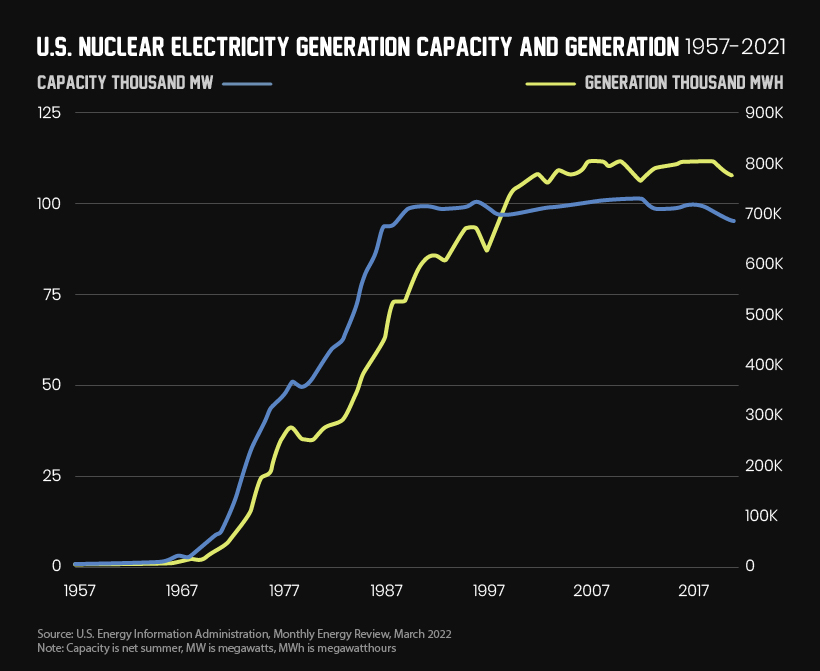
Most American reactors in operation were built between 1967 and 1990. Until 2013 there had been no new constructions started since 1977, according to the World Nuclear Association.
Nuclear power reactors in America receive 40-year operating licenses from the U.S. Nuclear Regulatory Commission (NRC), with companies able to apply for 20-year extensions. The oldest operating reactor, Nine Mile Point Unit 1 in New York, began commercial operation in December 1969. The newest reactor to enter service, Watts Bar Unit 2, came online in 2016.
The Future of Nuclear Power in the U.S.
U.S. nuclear power’s capacity peaked in 2012 at about 102,000 MW, with 104 operating nuclear reactors operating.
Since nuclear plants generate nearly 20% of U.S. electricity and about half of the country’s carbon‐free electricity, the recent push from the Biden administration to reduce fossil fuels and increase clean energy will require significant new nuclear capacity.
Today, there are two new reactors under construction (Vogtle 3 and 4) in Georgia, expected to come online before 2023.
Furthermore, some of the Inflation Reduction Act provisions include incentives for the nuclear industry. Starting in 2024, for example, utilities will be able to get a credit of $15 per megawatt-hour for electricity produced by existing nuclear plants. Nuclear infrastructure projects could also be eligible for up to $250 billion worth of loans to update, repurpose, and revitalize energy infrastructure that has stopped working.


Energy Shift
The World’s Biggest Oil Producers in 2023
Just three countries accounted for 40% of global oil production last year.

The World’s Biggest Oil Producers in 2023
This was originally posted on our Voronoi app. Download the app for free on iOS or Android and discover incredible data-driven charts from a variety of trusted sources.
Despite efforts to decarbonize the global economy, oil still remains one of the world’s most important resources. It’s also produced by a fairly limited group of countries, which can be a source of economic and political leverage.
This graphic illustrates global crude oil production in 2023, measured in million barrels per day, sourced from the U.S. Energy Information Administration (EIA).
Three Countries Account for 40% of Global Oil Production
In 2023, the United States, Russia, and Saudi Arabia collectively contributed 32.7 million barrels per day to global oil production.
| Oil Production 2023 | Million barrels per day |
|---|---|
| 🇺🇸 U.S. | 12.9 |
| 🇷🇺 Russia | 10.1 |
| 🇸🇦 Saudi Arabia | 9.7 |
| 🇨🇦 Canada | 4.6 |
| 🇮🇶 Iraq | 4.3 |
| 🇨🇳 China | 4.2 |
| 🇮🇷 Iran | 3.6 |
| 🇧🇷 Brazil | 3.4 |
| 🇦🇪 UAE | 3.4 |
| 🇰🇼 Kuwait | 2.7 |
| 🌍 Other | 22.8 |
These three nations have consistently dominated oil production since 1971. The leading position, however, has alternated among them over the past five decades.
In contrast, the combined production of the next three largest producers—Canada, Iraq, and China—reached 13.1 million barrels per day in 2023, just surpassing the production of the United States alone.
In the near term, no country is likely to surpass the record production achieved by the U.S. in 2023, as no other producer has ever reached a daily capacity of 13.0 million barrels. Recently, Saudi Arabia’s state-owned Saudi Aramco scrapped plans to increase production capacity to 13.0 million barrels per day by 2027.
In 2024, analysts forecast that the U.S. will maintain its position as the top oil producer. In fact, according to Macquarie Group, U.S. oil production is expected to achieve a record pace of about 14 million barrels per day by the end of the year.
Energy Shift
How Much Does the U.S. Depend on Russian Uranium?
Despite a new uranium ban being discussed in Congress, the U.S. is still heavily dependent on Russian uranium.

How Much Does the U.S. Depend on Russian Uranium?
This was originally posted on our Voronoi app. Download the app for free on iOS or Android and discover incredible data-driven charts from a variety of trusted sources.
The U.S. House of Representatives recently passed a ban on imports of Russian uranium. The bill must pass the Senate before becoming law.
In this graphic, we visualize how much the U.S. relies on Russian uranium, based on data from the United States Energy Information Administration (EIA).
U.S. Suppliers of Enriched Uranium
After Russia invaded Ukraine, the U.S. imposed sanctions on Russian-produced oil and gas—yet Russian-enriched uranium is still being imported.
Currently, Russia is the largest foreign supplier of nuclear power fuel to the United States. In 2022, Russia supplied almost a quarter of the enriched uranium used to fuel America’s fleet of more than 90 commercial reactors.
| Country of enrichment service | SWU* | % |
|---|---|---|
| 🇺🇸 United States | 3,876 | 27.34% |
| 🇷🇺 Russia | 3,409 | 24.04% |
| 🇩🇪 Germany | 1,763 | 12.40% |
| 🇬🇧 United Kingdom | 1,593 | 11.23% |
| 🇳🇱 Netherlands | 1,303 | 9.20% |
| Other | 2,232 | 15.79% |
| Total | 14,176 | 100% |
SWU stands for “Separative Work Unit” in the uranium industry. It is a measure of the amount of work required to separate isotopes of uranium during the enrichment process. Source: U.S. Energy Information Administration
Most of the remaining uranium is imported from European countries, while another portion is produced by a British-Dutch-German consortium operating in the United States called Urenco.
Similarly, nearly a dozen countries around the world depend on Russia for more than half of their enriched uranium—and many of them are NATO-allied members and allies of Ukraine.
In 2023 alone, the U.S. nuclear industry paid over $800 million to Russia’s state-owned nuclear energy corporation, Rosatom, and its fuel subsidiaries.
It is important to note that 19% of electricity in the U.S. is powered by nuclear plants.
The dependency on Russian fuels dates back to the 1990s when the United States turned away from its own enrichment capabilities in favor of using down-blended stocks of Soviet-era weapons-grade uranium.
As part of the new uranium-ban bill, the Biden administration plans to allocate $2.2 billion for the expansion of uranium enrichment facilities in the United States.

-

 Electrification3 years ago
Ranked: The Top 10 EV Battery Manufacturers
-

 Electrification2 years ago
The Key Minerals in an EV Battery
-

 Real Assets3 years ago
The World’s Top 10 Gold Mining Companies
-

 Misc3 years ago
All the Metals We Mined in One Visualization
-

 Electrification3 years ago
The Biggest Mining Companies in the World in 2021
-

 Energy Shift2 years ago
What Are the Five Major Types of Renewable Energy?
-

 Electrification2 years ago
The World’s Largest Nickel Mining Companies
-

 Electrification2 years ago
Mapped: Solar Power by Country in 2021