

Misc
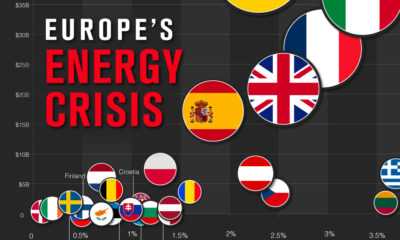
Mapped: How the Energy Crisis Impacts Global Food Insecurity
Mapped: How the Energy Crisis Impacts Global Food Insecurity
Food insecurity occurs when an individual does not have access to the adequate quantity or quality of food they require to meet their biological needs.
A disruption in supply chains, rising input costs, and inadequate weather can all have a direct impact on global food security, all of which have been in play in recent years.
Using data from the Food and Agriculture Organization (FAO) of the United Nations, let’s do a deep dive into food insecurity around the world and discuss how rising energy costs can drive up food prices, exacerbating food insecurity.
The State of Global Food Insecurity
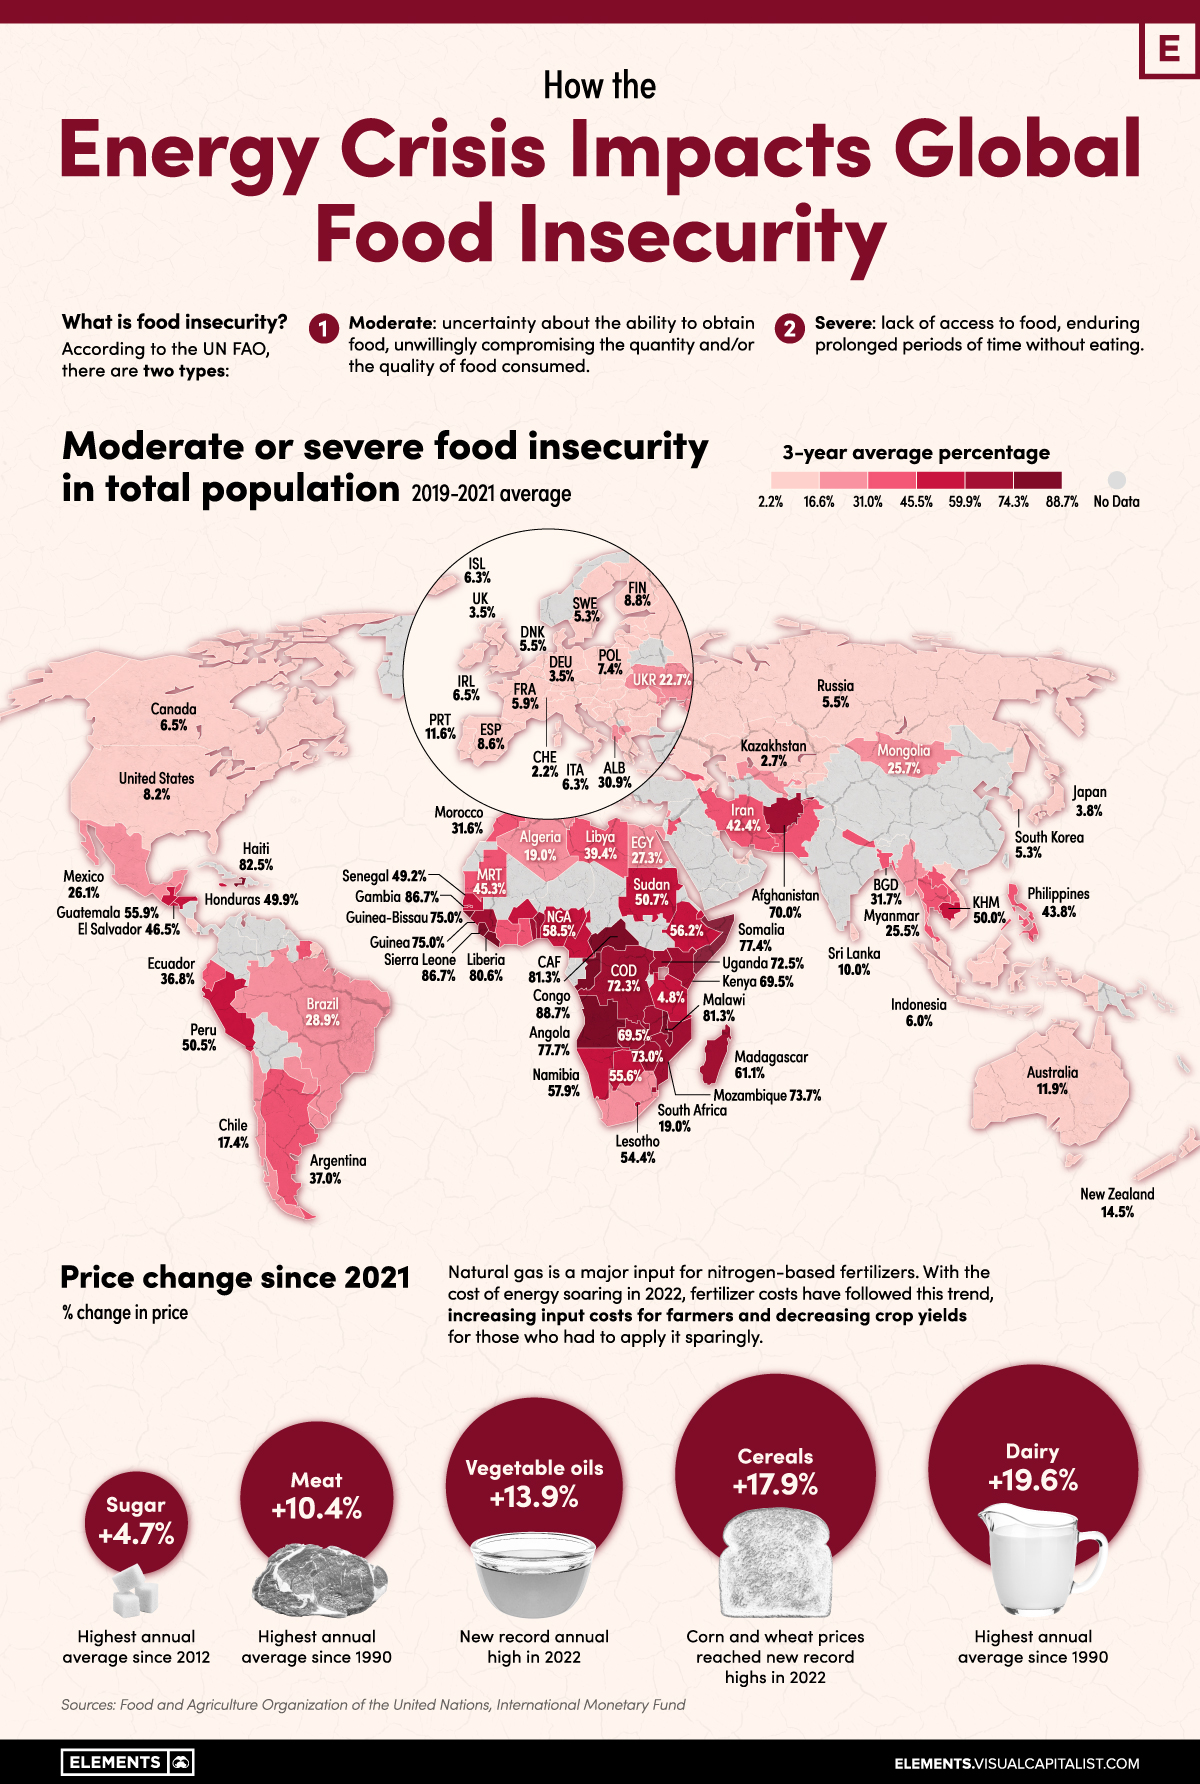
The latest data from the FAO marks 29.3% of the entire world population to be moderately or severely food insecure, with 40% of this population experiencing severe food insecurity. Based on FAO definitions, here is what that means:
- A moderately food insecure person experiences uncertainty about their ability to obtain food, unwillingly compromising the quantity and/or the quality of food they consume
- A severely food insecure person lacks access to food, enduring prolonged periods of time without eating
The African continent bears most of the burden when it comes to global food insecurity, with 14 out of the top 15 most food-insecure countries being in this region. The data also paints a relatively grim picture for Middle Eastern and South American countries, while North America and Western Europe have moderate or severe food insecurity marked below 10%.
| Country | Prevalence of moderate or severe food insecurity (3-year average, 2019-2021) |
|---|---|
| 🇨🇬 Congo | 88.7% |
| 🇸🇱 Sierra Leone | 86.7% |
| 🇸🇸 South Sudan | 86.4% |
| 🇭🇹 Haiti | 82.5% |
| 🇨🇫 Central African Republic | 81.3% |
| 🇲🇼 Malawi | 81.3% |
| 🇱🇷 Liberia | 80.6% |
It’s difficult to pinpoint the prevalence of African food insecurity to just one cause. Climate change, conflict in Africa, government debt, and Russia’s invasion of Ukraine have all contributed in different ways to worsening food security conditions in this region.
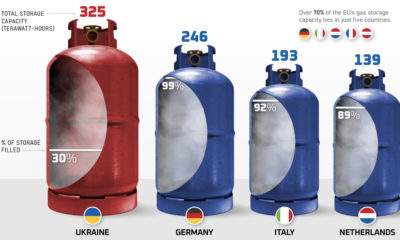
The Russia-Ukraine conflict, for instance, led to European aid for African countries to drop substantially, while grain exports from both Ukraine and Russia fell as ports in the Black Sea experienced disruptions. The war has also caused a disruption in fertilizer supplies, with Russia being the top exporter of fertilizer, along with a substantial rise in farming input costs as energy prices soared in 2022.
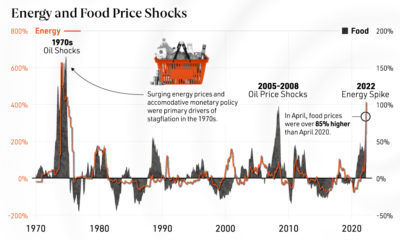
How Energy Prices Trickle Down to Food Prices
Food prices have risen substantially in the last year due to surging energy prices and supply chain disruptions. The FAO food price index, which measures the change in international prices of a basket of food commodities, saw a 14.3% increase between 2021 and 2022.
| Index | % change in price since 2021 |
|---|---|
| General Food Price Index | 14.3% |
| Meat | 10.4% |
| Dairy | 19.6% |
| Cereals | 17.9% |
| Vegetable oils | 13.9% |
| Sugar | 4.7% |
As seen above, individual commodity indices followed this trend, with dairy and cereal prices bearing the brunt.
Energy costs trickle down to food prices in a variety of ways. The simple correlation between historic oil and corn prices, seen below, can paint a telling picture.
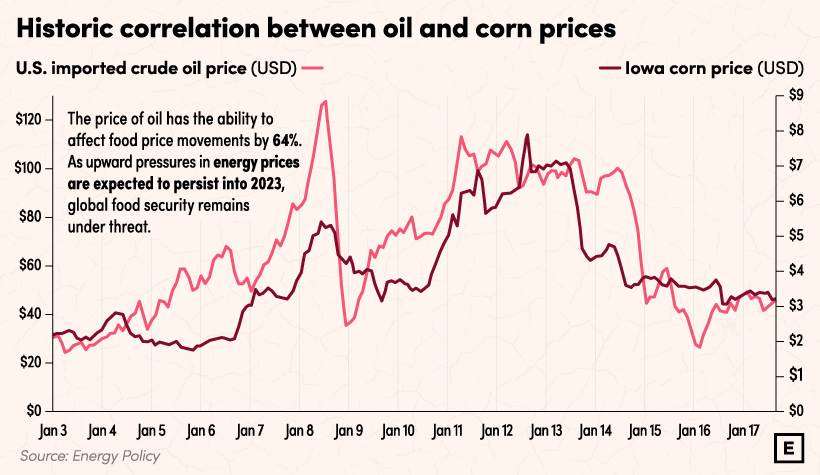
What’s interesting is that the International Monetary Fund (IMF) predicts that the effects of the 2022 energy cost crisis may not have even fully materialized yet.
According to their research, a 1% increase in fertilizer prices can boost food commodity prices by 0.45% within four quarters. With natural gas, a major input for nitrogen-based fertilizer, being 150% more expensive in 2022 than in 2021, this may be a cause for concern in the upcoming months.
Relatedly, a rise in fertilizer costs is also connected to harvest levels in upcoming seasons. Reduced use of fertilizer as a result of high costs can lead to diminished crop yields, and the IMF predicts that a 1% drop in global harvests bumps food commodity prices by 8.5%, potentially indicating that the worst of it for food prices—and for global food security—is still yet to come.
Looking Ahead to 2023
Food security is a fundamental aspect of human existence and plays an important role in the steady economic growth and prosperity of nations. While we may be tempted to believe that we’re heading in the right direction on a global scale, the FAO paints a different picture, specifically for Africa.
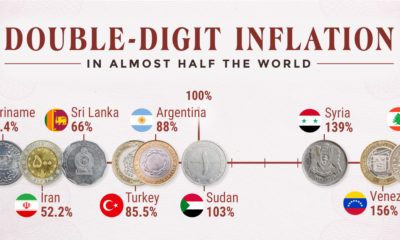
2030 predictions for global undernourishment forecast an 11.5% increase in hunger in Africa, while world hunger at large is predicted to decrease. With global inflation looming high and food prices still under the influence of 2022 events, addressing hunger in Africa is as crucial as ever to improve the overall well-being and development of the continent.


Misc
Brass Rods: The Secure Choice
This graphic shows why brass rods are the secure choice for precision-machined and forged parts.

Brass Rods: The Secure Choice
The unique combination of machinability and recyclability makes brass rods the secure choice for manufacturers seeking future-proof raw material solutions.
This infographic, from the Copper Development Association, shows three ways brass rods give manufacturers greater control and a license to grow in the competitive market for precision-machined and forged products.
Future-Proof Investments in New Machine Tools
A material’s machinability directly impacts machine throughput, which typically has the largest impact on machine shop profitability.
The high-speed machining capabilities of brass rods maximize machine tool performance, allowing manufacturers to run the material faster and longer without sacrificing tool life, chip formation, or surface quality.
The high machining efficiency of brass leads to reduced per-part costs, quicker return on investment (ROI) for new machine tools, and expanded production capacity for new projects.
Supply Security Through Closed Loop Recycling
Brass, like its parent element copper, can be infinitely recycled.
In 2022, brass- and wire-rod mills accounted for the majority of the 830,000 tonnes of copper recycled from scrap in the U.S.
Given that scrap ratios for machined parts typically range from 60-70% by weight, producing mills benefit from a secure and steady supply of clean scrap returned directly from customers, which is recycled to create new brass rods.
The high residual value of brass scrap creates a strong recycling incentive. Scrap buy back programs give manufacturers greater control over raw material net costs as scrap value is often factored into supplier purchase agreements.
Next Generation Alloys for a Lead-Free Future
Increasingly stringent global regulations continue to pressure manufacturers to minimize the use of materials containing trace amounts of lead and other harmful impurities.
The latest generation of brass-rod alloys is engineered to meet the most demanding criteria for lead leaching in drinking water and other sensitive applications.
Seven brass-rod alloys passed rigorous testing to become the only ‘Acceptable Materials’ against lower lead leaching criteria recently adopted in the national U.S. drinking water quality standard, NSF 61.
Learn more about the advantages of brass rods solutions.
Misc
Brass Rods: The Safe Choice
From airbags to firefighting equipment, components made from brass rods play a vital role in creating a safer environment.

Brass Rods: The Safe Choice
From airbags to firefighting equipment, components made from brass rods play a vital role in creating a safer environment.
This infographic from the Copper Development Association illustrates three use cases for brass. This is the first of three infographics in our Choose Brass series.
Why Brass?
Brass is one of the most reliable metals for industrial and other applications. It contains little to no iron, protecting it from oxidation, which can cause other materials to fail over time.
Additionally, the malleability of brass ensures tight and leak-free metal-to-metal seals for threaded joints, minimizing the risk of costly and dangerous system failures. Brass’s durability ensures critical system components function properly for years.
Brass for Safe Water Systems
Exposure to lead in water can cause various health problems, including neurological damage, developmental delays, and cardiovascular diseases.
As a result, the U.S. sets minimum health-effect requirements for chemical contaminants and impurities indirectly transferred to drinking water from products, components, and materials used in water systems.
Currently, only brass rod alloys are designated as “acceptable materials” according to national standards.
Brass is also essential for ensuring workplace safety, particularly in high-risk manufacturing environments.
Using Brass for Safe Manufacturing and Industrial Environments
Brass is used extensively in industrial applications such as machinery components, valves, fittings, architectural elements, bearings, and gears.
The machinability of brass rods also means longer tool life and higher productivity for manufacturers of precision parts.
The microstructure of brass helps break up metal chips generated during machining operations, preventing long and stringy chips that can crash machines and seriously injure operators.
Additionally, brass’s non-sparking properties make it ideal for tooling, fittings, and components in high-risk industries such as oil & gas, chemicals, pharmaceuticals, paint manufacturing, power plants, and explosives.
Brass for Safer Communities
Many pieces of equipment in our daily lives also rely on brass rod parts to function. Control valves in gas stoves, BBQs, and home furnaces made from brass rods reduce the risk of deadly gas leaks and fires.
Moreover, brass is ideal for firefighting equipment due to its corrosion resistance, durability, heat resistance, and non-sparking properties.
Fittings made from brass rods ensure that the brakes and airbags in our vehicles work when needed.
Brass and other copper-based alloys are also naturally antimicrobial, helping prevent diseases when used in high-touch surfaces such as door handles.
These are only some of the ways that brass rods help build a safer world for everyone.
Explore the Advantages of Brass Rod Solutions.

-

 Electrification3 years ago
Ranked: The Top 10 EV Battery Manufacturers
-

 Electrification2 years ago
The Key Minerals in an EV Battery
-

 Real Assets3 years ago
The World’s Top 10 Gold Mining Companies
-

 Misc3 years ago
All the Metals We Mined in One Visualization
-

 Electrification3 years ago
The Biggest Mining Companies in the World in 2021
-

 Energy Shift2 years ago
What Are the Five Major Types of Renewable Energy?
-

 Electrification2 years ago
The World’s Largest Nickel Mining Companies
-

 Electrification2 years ago
Mapped: Solar Power by Country in 2021