

Energy Shift
Europe’s Gas Storage Compared to Historical Consumption
Europe’s Gas Storage Compared to Historical Consumption
In the wake of the energy crisis, Europe has been rushing to cut ties with Russian gas.
In 2021, Russia accounted for around 45% of the EU’s gas imports. As of August 2022, that figure was around 17%.
However, reducing reliance on Russian gas after years of dependence has put Europe in a precarious situation ahead of winter. To reduce the possibility of an energy crunch in the heating season, the EU bloc set a target to fill 80% of its underground gas storage by November 1.
This infographic puts Europe’s current gas storage levels in perspective by comparing them with annual gas consumption in 2021, based on data from Gas Infrastructure Europe as of November 28, 2022.
Heat For the Winter
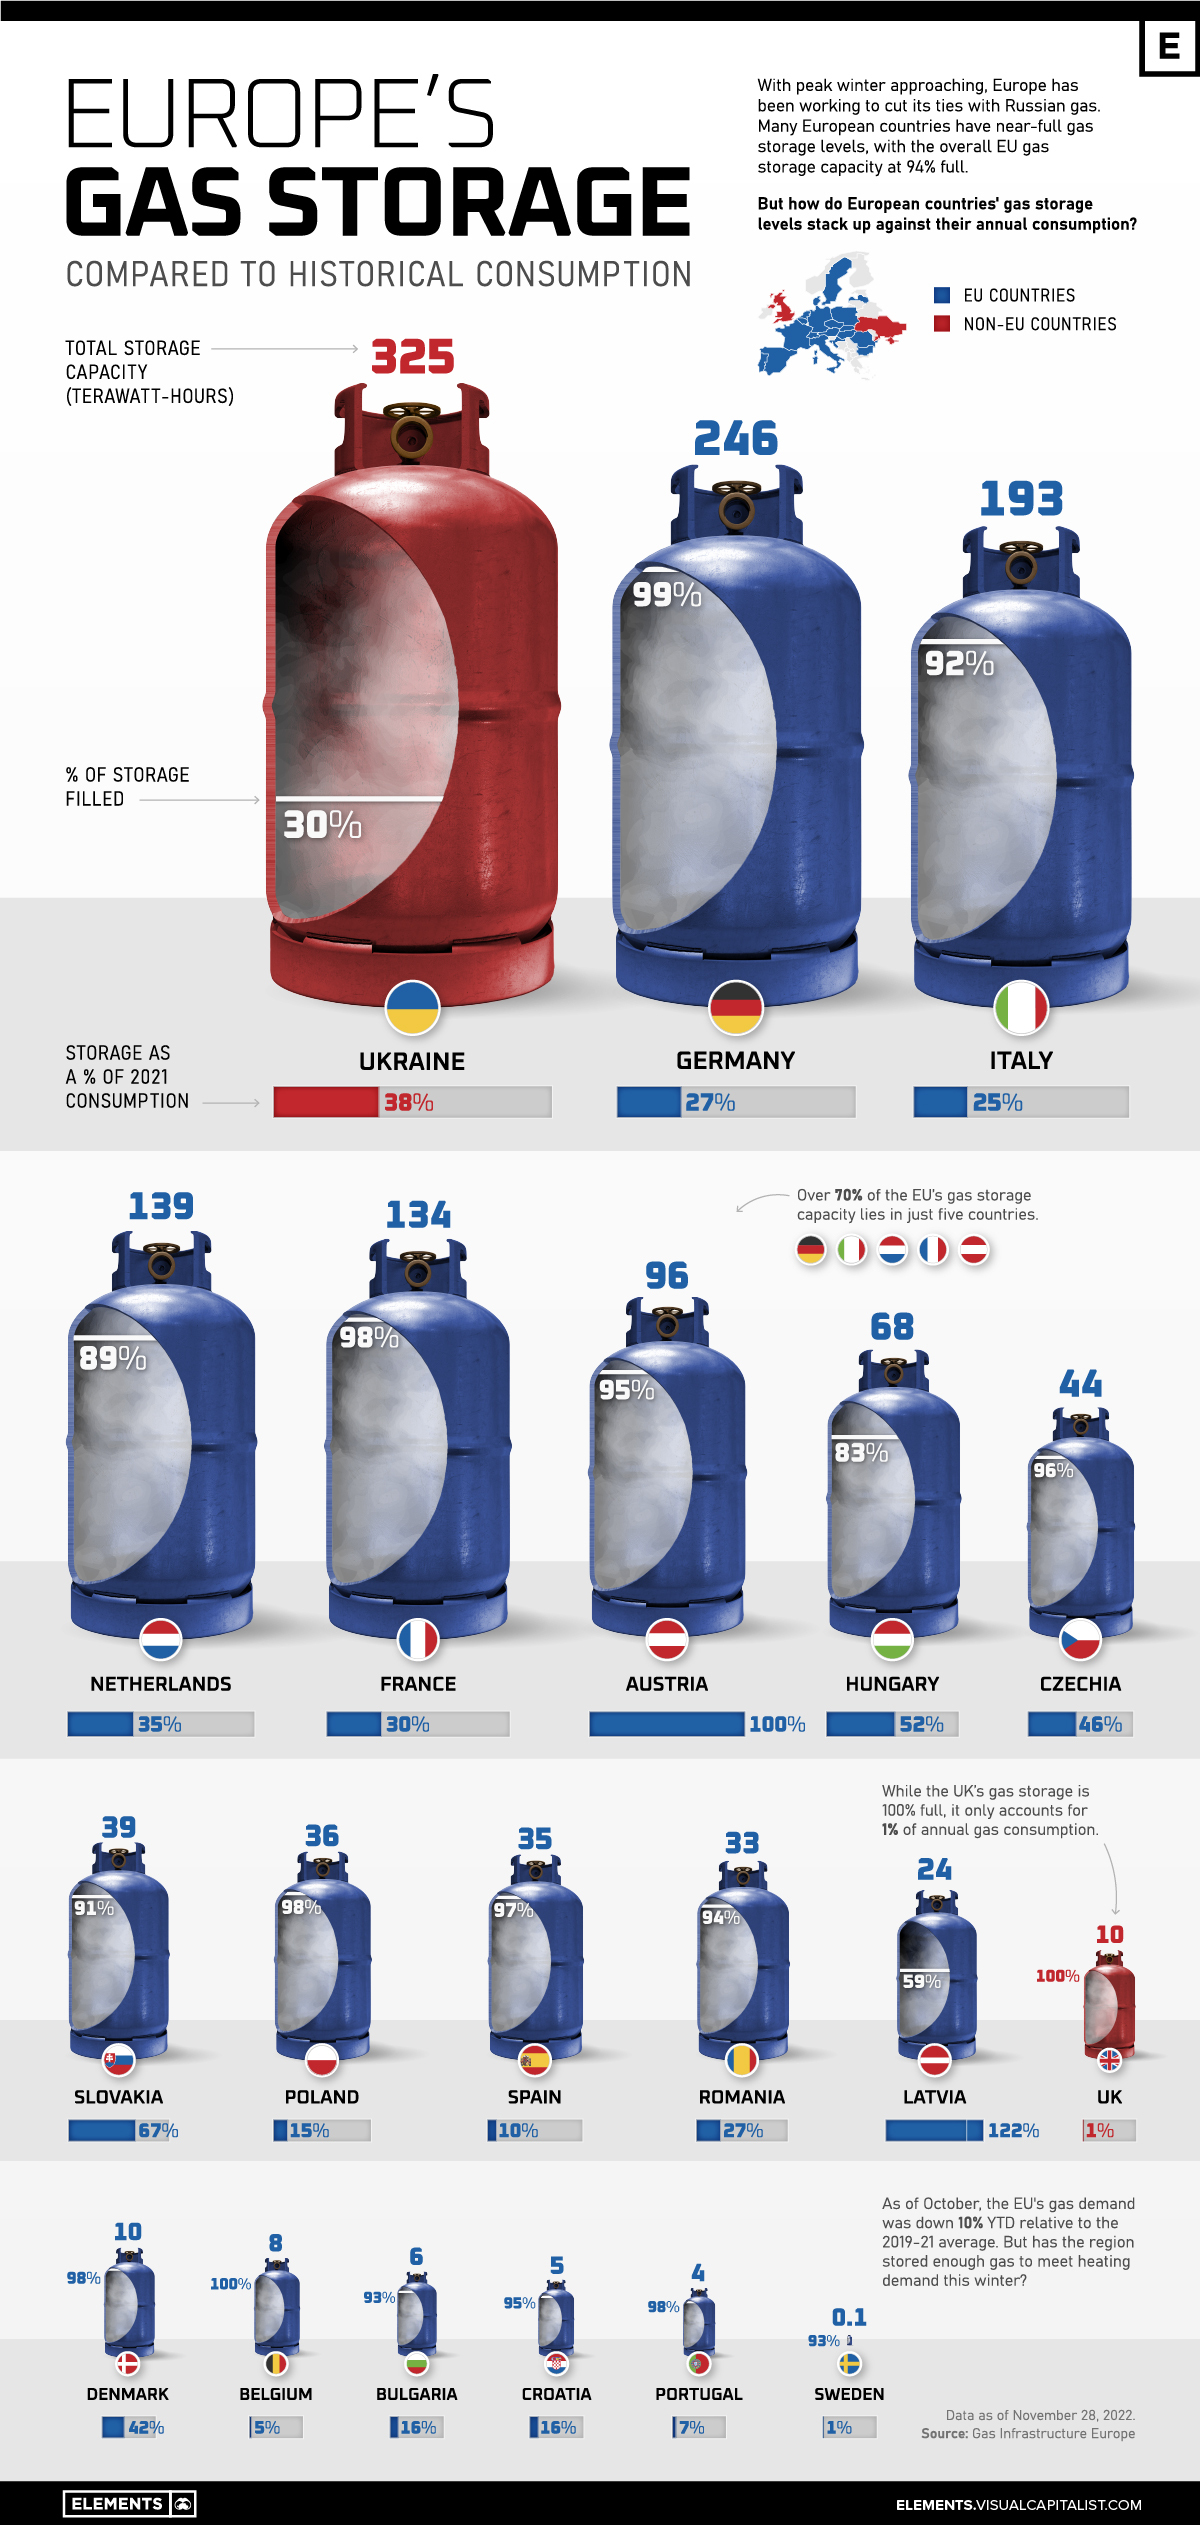
As winter approaches, many European countries have near-full gas storage levels, with the overall EU gas storage 94% full. But comparing storage with annual consumption paints a different picture.
| Country | Total Storage Capacity (TWh) | % of Storage Filled | Storage as a % of Annual Consumption |
|---|---|---|---|
| 🇺🇦 Ukraine* | 325 | 30% | 38% |
| 🇩🇪 Germany | 246 | 99% | 27% |
| 🇮🇹 Italy | 193 | 92% | 25% |
| 🇳🇱 Netherlands | 139 | 89% | 35% |
| 🇫🇷 France | 134 | 98% | 30% |
| 🇦🇹 Austria | 96 | 95% | 100% |
| 🇭🇺 Hungary | 68 | 83% | 52% |
| 🇨🇿 Czech Republic | 44 | 96% | 46% |
| 🇸🇰 Slovakia | 39 | 91% | 67% |
| 🇵🇱 Poland | 36 | 98% | 15% |
| 🇪🇸 Spain | 35 | 97% | 10% |
| 🇷🇴 Romania | 33 | 94% | 27% |
| 🇱🇻 Latvia | 24 | 59% | 122% |
| 🇩🇰 Denmark | 10 | 98% | 42% |
| 🇬🇧 UK* | 10 | 100% | 1% |
| 🇧🇪 Belgium | 8 | 100% | 5% |
| 🇧🇬 Bulgaria | 6 | 93% | 16% |
| 🇭🇷 Croatia | 5 | 95% | 16% |
| 🇵🇹 Portugal | 4 | 98% | 7% |
| 🇸🇪 Sweden | 0.1 | 93% | 1% |
| EU 🇪🇺 | 1119 | 94% | 28% |
*Ukraine and UK are non-EU countries. Nine EU countries that are not on the list do not have any gas storage sites.
Ukraine has the largest storage capacity, and while it’s only 30% full, it represents nearly 40% of the country’s annual gas consumption. However, Russia’s continuing attacks on Ukraine’s energy infrastructure may squeeze supplies as temperatures drop.
The Nations at Risk of Running Low on Gas
Germany, Europe’s biggest economy and largest importer of Russian gas, has almost completely filled its gas storage. Despite this, storage supplies only amount to 27% of annual German gas consumption. Given that half of all German households use natural gas for heating, these stocks are especially important as winter peaks.
While storage facilities in countries like Poland, Spain, and Belgium are over 90% full, they represent only a fraction of annual gas consumption at 15%, 10%, and 5% respectively. Meanwhile, countries like Austria and Latvia have stored more gas than they consume in an entire year.
The UK’s gas storage is full but makes up just 1% of its annual consumption. The majority of UK homes rely on gas for heating, and it also accounts for 30% of electricity generation. A gas crunch could lead to both higher heating and electricity prices for UK residents.
What’s Next for Europe’s Gas Crisis?
This year, warmer-than-normal temperatures and efforts to reduce gas consumption have both played important roles in controlling Europe’s energy crisis before winter sets in.
However, the region’s reliance on Russia was decades in the making, and replacing it won’t be easy. EU countries’ gas storage sites are likely to be depleted by the spring of 2023. Without pipeline gas from Russia, Europe will have limited import capacity, and filling gas storage sites for next winter could be challenging.
Europe is undertaking a number of initiatives to combat the crisis. Countries in the region (including the UK) have pledged over $700 billion to reduce energy costs for households and to meet the liquidity needs of power companies. This, along with lower consumer demand due to high gas prices, will help lessen the impacts of the crisis in the short term.
However, looking ahead to 2023 and 2024, if gas prices remain high, industrial production is likely to fall as producers cut costs. Combined with low consumer confidence and high inflation, a fall in industrial output will likely exacerbate a potential recession, should things unfold that way.


Energy Shift
The World’s Biggest Oil Producers in 2023
Just three countries accounted for 40% of global oil production last year.

The World’s Biggest Oil Producers in 2023
This was originally posted on our Voronoi app. Download the app for free on iOS or Android and discover incredible data-driven charts from a variety of trusted sources.
Despite efforts to decarbonize the global economy, oil still remains one of the world’s most important resources. It’s also produced by a fairly limited group of countries, which can be a source of economic and political leverage.
This graphic illustrates global crude oil production in 2023, measured in million barrels per day, sourced from the U.S. Energy Information Administration (EIA).
Three Countries Account for 40% of Global Oil Production
In 2023, the United States, Russia, and Saudi Arabia collectively contributed 32.7 million barrels per day to global oil production.
| Oil Production 2023 | Million barrels per day |
|---|---|
| 🇺🇸 U.S. | 12.9 |
| 🇷🇺 Russia | 10.1 |
| 🇸🇦 Saudi Arabia | 9.7 |
| 🇨🇦 Canada | 4.6 |
| 🇮🇶 Iraq | 4.3 |
| 🇨🇳 China | 4.2 |
| 🇮🇷 Iran | 3.6 |
| 🇧🇷 Brazil | 3.4 |
| 🇦🇪 UAE | 3.4 |
| 🇰🇼 Kuwait | 2.7 |
| 🌍 Other | 22.8 |
These three nations have consistently dominated oil production since 1971. The leading position, however, has alternated among them over the past five decades.
In contrast, the combined production of the next three largest producers—Canada, Iraq, and China—reached 13.1 million barrels per day in 2023, just surpassing the production of the United States alone.
In the near term, no country is likely to surpass the record production achieved by the U.S. in 2023, as no other producer has ever reached a daily capacity of 13.0 million barrels. Recently, Saudi Arabia’s state-owned Saudi Aramco scrapped plans to increase production capacity to 13.0 million barrels per day by 2027.
In 2024, analysts forecast that the U.S. will maintain its position as the top oil producer. In fact, according to Macquarie Group, U.S. oil production is expected to achieve a record pace of about 14 million barrels per day by the end of the year.
Energy Shift
How Much Does the U.S. Depend on Russian Uranium?
Despite a new uranium ban being discussed in Congress, the U.S. is still heavily dependent on Russian uranium.

How Much Does the U.S. Depend on Russian Uranium?
This was originally posted on our Voronoi app. Download the app for free on iOS or Android and discover incredible data-driven charts from a variety of trusted sources.
The U.S. House of Representatives recently passed a ban on imports of Russian uranium. The bill must pass the Senate before becoming law.
In this graphic, we visualize how much the U.S. relies on Russian uranium, based on data from the United States Energy Information Administration (EIA).
U.S. Suppliers of Enriched Uranium
After Russia invaded Ukraine, the U.S. imposed sanctions on Russian-produced oil and gas—yet Russian-enriched uranium is still being imported.
Currently, Russia is the largest foreign supplier of nuclear power fuel to the United States. In 2022, Russia supplied almost a quarter of the enriched uranium used to fuel America’s fleet of more than 90 commercial reactors.
| Country of enrichment service | SWU* | % |
|---|---|---|
| 🇺🇸 United States | 3,876 | 27.34% |
| 🇷🇺 Russia | 3,409 | 24.04% |
| 🇩🇪 Germany | 1,763 | 12.40% |
| 🇬🇧 United Kingdom | 1,593 | 11.23% |
| 🇳🇱 Netherlands | 1,303 | 9.20% |
| Other | 2,232 | 15.79% |
| Total | 14,176 | 100% |
SWU stands for “Separative Work Unit” in the uranium industry. It is a measure of the amount of work required to separate isotopes of uranium during the enrichment process. Source: U.S. Energy Information Administration
Most of the remaining uranium is imported from European countries, while another portion is produced by a British-Dutch-German consortium operating in the United States called Urenco.
Similarly, nearly a dozen countries around the world depend on Russia for more than half of their enriched uranium—and many of them are NATO-allied members and allies of Ukraine.
In 2023 alone, the U.S. nuclear industry paid over $800 million to Russia’s state-owned nuclear energy corporation, Rosatom, and its fuel subsidiaries.
It is important to note that 19% of electricity in the U.S. is powered by nuclear plants.
The dependency on Russian fuels dates back to the 1990s when the United States turned away from its own enrichment capabilities in favor of using down-blended stocks of Soviet-era weapons-grade uranium.
As part of the new uranium-ban bill, the Biden administration plans to allocate $2.2 billion for the expansion of uranium enrichment facilities in the United States.

-

 Electrification3 years ago
Ranked: The Top 10 EV Battery Manufacturers
-

 Electrification2 years ago
The Key Minerals in an EV Battery
-

 Real Assets3 years ago
The World’s Top 10 Gold Mining Companies
-

 Misc3 years ago
All the Metals We Mined in One Visualization
-

 Electrification3 years ago
The Biggest Mining Companies in the World in 2021
-

 Energy Shift2 years ago
What Are the Five Major Types of Renewable Energy?
-

 Electrification2 years ago
Mapped: Solar Power by Country in 2021
-

 Electrification2 years ago
The World’s Largest Nickel Mining Companies