

Energy Shift
Mapped: Global Energy Prices, by Country in 2022
How to use: Arrows on side navigate between each type of energy.


Mapped: Global Energy Prices, by Country in 2022
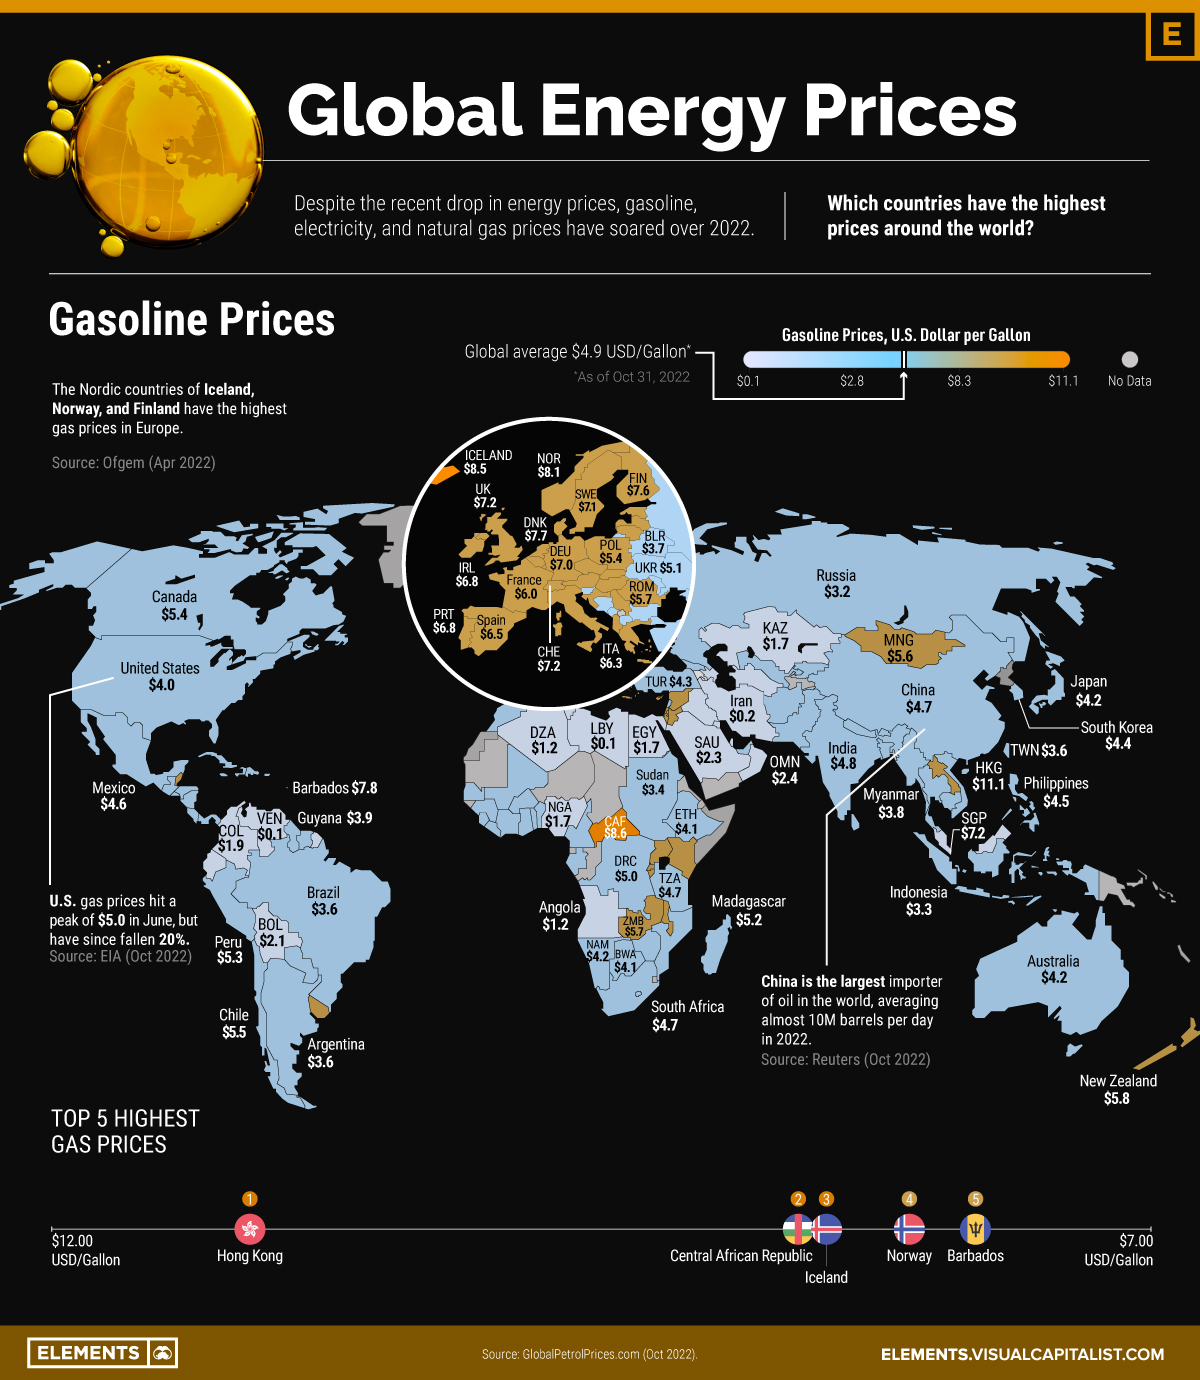
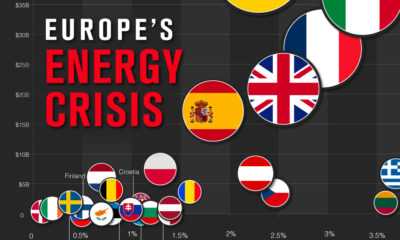
For some countries, energy prices hit historic levels in 2022.
Gasoline, electricity, and natural gas prices skyrocketed as Russia’s invasion of Ukraine ruptured global energy supply chains. Households and businesses are facing higher energy bills amid extreme price volatility. Uncertainty surrounding the war looms large, and winter heating costs are projected to soar.
Given the global consequences of the energy crisis, the above infographic shows the price of energy for households by country, with data from GlobalPetrolPrices.com.
1. Global Energy Prices: Gasoline
Which countries and regions pay the most for a gallon of gas?
| Rank | Country/ Region | Gasoline Prices (USD/ Gallon) |
|---|---|---|
| 1 | 🇭🇰 Hong Kong | $11.1 |
| 2 | 🇨🇫 Central African Republic | $8.6 |
| 3 | 🇮🇸 Iceland | $8.5 |
| 4 | 🇳🇴 Norway | $8.1 |
| 5 | 🇧🇧 Barbados | $7.8 |
| 6 | 🇩🇰 Denmark | $7.7 |
| 7 | 🇬🇷 Greece | $7.6 |
| 8 | 🇫🇮 Finland | $7.6 |
| 9 | 🇳🇱 Netherlands | $7.6 |
| 10 | 🇧🇪 Belgium | $7.4 |
| 11 | 🇬🇧 United Kingdom | $7.2 |
| 12 | 🇪🇪 Estonia | $7.2 |
| 13 | 🇨🇭 Switzerland | $7.2 |
| 14 | 🇸🇬 Singapore | $7.2 |
| 15 | 🇸🇪 Sweden | $7.1 |
| 16 | 🇸🇨 Seychelles | $7.1 |
| 17 | 🇮🇱 Israel | $7.0 |
| 18 | 🇩🇪 Germany | $7.0 |
| 19 | 🇺🇾 Uruguay | $7.0 |
| 20 | 🇼🇫 Wallis and Futuna | $7.0 |
| 21 | 🇱🇮 Liechtenstein | $6.9 |
| 22 | 🇮🇪 Ireland | $6.8 |
| 23 | 🇵🇹 Portugal | $6.8 |
| 24 | 🇱🇻 Latvia | $6.7 |
| 25 | 🇧🇿 Belize | $6.7 |
| 26 | 🇦🇱 Albania | $6.6 |
| 27 | 🇦🇹 Austria | $6.6 |
| 28 | 🇲🇨 Monaco | $6.6 |
| 29 | 🇪🇸 Spain | $6.5 |
| 30 | 🇨🇿 Czech Republic | $6.5 |
| 31 | 🇲🇼 Malawi | $6.5 |
| 32 | 🇰🇾 Cayman Islands | $6.4 |
| 33 | 🇸🇰 Slovakia | $6.4 |
| 34 | 🇲🇺 Mauritius | $6.3 |
| 35 | 🇱🇺 Luxembourg | $6.3 |
| 36 | 🇱🇹 Lithuania | $6.3 |
| 37 | 🇦🇩 Andorra | $6.3 |
| 38 | 🇮🇹 Italy | $6.3 |
| 39 | 🇺🇬 Uganda | $6.2 |
| 40 | 🇭🇺 Hungary | $6.2 |
| 41 | 🇯🇴 Jordan | $6.2 |
| 42 | 🇸🇾 Syria | $6.1 |
| 43 | 🇫🇷 France | $6.0 |
| 44 | 🇧🇮 Burundi | $6.0 |
| 45 | 🇧🇸 Bahamas | $6.0 |
| 46 | 🇳🇿 New Zealand | $5.8 |
| 47 | 🇸🇲 San Marino | $5.8 |
| 48 | 🇭🇷 Croatia | $5.8 |
| 49 | 🇷🇴 Romania | $5.7 |
| 50 | 🇾🇹 Mayotte | $5.7 |
| 51 | 🇷🇼 Rwanda | $5.7 |
| 52 | 🇿🇲 Zambia | $5.7 |
| 53 | 🇷🇸 Serbia | $5.7 |
| 54 | 🇱🇦 Laos | $5.6 |
| 55 | 🇲🇳 Mongolia | $5.6 |
| 56 | 🇰🇪 Kenya | $5.6 |
| 57 | 🇨🇾 Cyprus | $5.6 |
| 58 | 🇯🇲 Jamaica | $5.5 |
| 59 | 🇲🇰 Northern Macedonia | $5.5 |
| 60 | 🇨🇱 Chile | $5.5 |
| 61 | 🇧🇦 Bosnia | $5.5 |
| 62 | 🇱🇨 Saint Lucia | $5.4 |
| 63 | 🇵🇱 Poland | $5.4 |
| 64 | 🇩🇴 Dominican Republic | $5.4 |
| 65 | 🇨🇦 Canada | $5.4 |
| 66 | 🇲🇦 Morocco | $5.4 |
| 67 | 🇦🇼 Aruba | $5.4 |
| 68 | 🇸🇮 Slovenia | $5.3 |
| 69 | 🇧🇬 Bulgaria | $5.3 |
| 70 | 🇵🇪 Peru | $5.3 |
| 71 | 🇱🇰 Sri Lanka | $5.3 |
| 72 | 🇨🇷 Costa Rica | $5.2 |
| 73 | 🇲🇬 Madagascar | $5.2 |
| 74 | 🇬🇳 Guinea | $5.2 |
| 75 | 🇳🇵 Nepal | $5.2 |
| 76 | 🇲🇿 Mozambique | $5.2 |
| 77 | 🇳🇮 Nicaragua | $5.2 |
| 78 | 🇲🇱 Mali | $5.1 |
| 79 | 🇸🇳 Senegal | $5.1 |
| 80 | 🇺🇦 Ukraine | $5.1 |
| 81 | 🇩🇲 Dominica | $5.0 |
| 82 | 🇲🇪 Montenegro | $5.0 |
| 83 | 🇲🇹 Malta | $5.0 |
| 84 | 🇲🇩 Moldova | $5.0 |
| 85 | 🇨🇩 DR Congo | $5.0 |
| 86 | 🇨🇼 Curacao | $4.9 |
| 87 | 🇨🇻 Cape Verde | $4.9 |
| 88 | 🇧🇩 Bangladesh | $4.9 |
| 89 | 🇱🇷 Liberia | $4.8 |
| 90 | 🇰🇭 Cambodia | $4.8 |
| 91 | 🇮🇳 India | $4.8 |
| 92 | 🇨🇺 Cuba | $4.8 |
| 93 | 🇭🇳 Honduras | $4.7 |
| 94 | 🇬🇪 Georgia | $4.7 |
| 95 | 🇿🇦 South Africa | $4.7 |
| 96 | 🇹🇿 Tanzania | $4.7 |
| 97 | 🇫🇯 Fiji | $4.7 |
| 98 | 🇨🇳 China | $4.7 |
| 99 | 🇲🇽 Mexico | $4.6 |
| 100 | 🇬🇹 Guatemala | $4.6 |
Source: GlobalPetrolPrices.com. As of October 31, 2022. Represents average household prices.
At an average $11.10 per gallon, households in Hong Kong pay the highest for gasoline in the world—more than double the global average. Both high gas taxes and steep land costs are primary factors behind high gas prices.
Like Hong Kong, the Central African Republic has high gas costs, at $8.60 per gallon. As a net importer of gasoline, the country has faced increased price pressures since the war in Ukraine.
Households in Iceland, Norway, and Denmark face the highest gasoline costs in Europe. Overall, Europe has seen inflation hit 10% in September, driven by the energy crisis.
2. Global Energy Prices: Electricity
Extreme volatility is also being seen in electricity prices.
The majority of the highest household electricity prices are in Europe, where Denmark, Germany, and Belgium’s prices are about double that of France and Greece. For perspective, electricity prices in many countries in Europe are more than twice or three times the global average of $0.14 per kilowatt-hour.
Over the first quarter of 2022, household electricity prices in the European Union jumped 32% compared to the year before.
| Rank | Country/ Region | Electricity Prices (kWh, USD) |
|---|---|---|
| 1 | 🇩🇰 Denmark | $0.46 |
| 2 | 🇩🇪 Germany | $0.44 |
| 3 | 🇧🇪 Belgium | $0.41 |
| 4 | 🇧🇲 Bermuda | $0.40 |
| 5 | 🇰🇾 Cayman Islands | $0.35 |
| 6 | 🇯🇲 Jamaica | $0.34 |
| 7 | 🇬🇧 United Kingdom | $0.32 |
| 8 | 🇪🇸 Spain | $0.32 |
| 9 | 🇳🇱 Netherlands | $0.32 |
| 10 | 🇧🇧 Barbados | $0.32 |
| 11 | 🇪🇪 Estonia | $0.32 |
| 12 | 🇱🇹 Lithuania | $0.31 |
| 13 | 🇦🇹 Austria | $0.31 |
| 14 | 🇮🇹 Italy | $0.30 |
| 15 | 🇨🇿 Czech Republic | $0.29 |
| 16 | 🇨🇻 Cape Verde | $0.28 |
| 17 | 🇮🇪 Ireland | $0.28 |
| 18 | 🇸🇪 Sweden | $0.27 |
| 19 | 🇧🇸 Bahamas | $0.26 |
| 20 | 🇬🇹 Guatemala | $0.26 |
| 21 | 🇱🇮 Liechtenstein | $0.26 |
| 22 | 🇨🇾 Cyprus | $0.25 |
| 23 | 🇷🇼 Rwanda | $0.25 |
| 24 | 🇭🇳 Honduras | $0.24 |
| 25 | 🇺🇾 Uruguay | $0.24 |
| 26 | 🇵🇹 Portugal | $0.24 |
| 27 | 🇸🇻 El Salvador | $0.23 |
| 28 | 🇱🇻 Latvia | $0.22 |
| 29 | 🇫🇮 Finland | $0.22 |
| 30 | 🇱🇺 Luxembourg | $0.22 |
| 31 | 🇧🇿 Belize | $0.22 |
| 32 | 🇯🇵 Japan | $0.22 |
| 33 | 🇨🇭 Switzerland | $0.22 |
| 34 | 🇵🇪 Peru | $0.21 |
| 35 | 🇰🇪 Kenya | $0.21 |
| 36 | 🇦🇺 Australia | $0.21 |
| 37 | 🇧🇷 Brazil | $0.20 |
| 38 | 🇲🇱 Mali | $0.20 |
| 39 | 🇸🇬 Singapore | $0.19 |
| 40 | 🇷🇴 Romania | $0.19 |
| 41 | 🇧🇫 Burkina Faso | $0.19 |
| 42 | 🇸🇮 Slovenia | $0.19 |
| 43 | 🇬🇦 Gabon | $0.19 |
| 44 | 🇸🇰 Slovakia | $0.19 |
| 45 | 🇦🇼 Aruba | $0.19 |
| 46 | 🇬🇷 Greece | $0.19 |
| 47 | 🇫🇷 France | $0.18 |
| 48 | 🇳🇿 New Zealand | $0.18 |
| 49 | 🇹🇬 Togo | $0.18 |
| 50 | 🇳🇮 Nicaragua | $0.17 |
| 51 | 🇻🇪 Venezuela | $0.17 |
| 52 | 🇵🇦 Panama | $0.17 |
| 53 | 🇵🇭 Philippines | $0.17 |
| 54 | 🇵🇱 Poland | $0.17 |
| 55 | 🇮🇱 Israel | $0.16 |
| 56 | 🇺🇲 U.S. | $0.16 |
| 57 | 🇺🇬 Uganda | $0.16 |
| 58 | 🇭🇰 Hong Kong | $0.16 |
| 59 | 🇸🇳 Senegal | $0.16 |
| 60 | 🇲🇴 Macao | $0.15 |
| 61 | 🇨🇱 Chile | $0.15 |
| 62 | 🇰🇭 Cambodia | $0.15 |
| 63 | 🇿🇦 South Africa | $0.14 |
| 64 | 🇲🇺 Mauritius | $0.14 |
| 65 | 🇲🇬 Madagascar | $0.14 |
| 66 | 🇭🇷 Croatia | $0.14 |
| 67 | 🇮🇸 Iceland | $0.14 |
| 68 | 🇳🇴 Norway | $0.13 |
| 69 | 🇲🇹 Malta | $0.13 |
| 70 | 🇲🇿 Mozambique | $0.13 |
| 71 | 🇨🇴 Colombia | $0.13 |
| 72 | 🇧🇬 Bulgaria | $0.12 |
| 73 | 🇲🇻 Maldives | $0.12 |
| 74 | 🇨🇷 Costa Rica | $0.12 |
| 75 | 🇨🇦 Canada | $0.11 |
| 76 | 🇲🇼 Malawi | $0.11 |
| 77 | 🇨🇮 Ivory Coast | $0.11 |
| 78 | 🇳🇦 Namibia | $0.11 |
| 79 | 🇲🇦 Morocco | $0.11 |
| 80 | 🇹🇭 Thailand | $0.10 |
| 81 | 🇦🇲 Armenia | $0.10 |
| 82 | 🇯🇴 Jordan | $0.10 |
| 83 | 🇹🇿 Tanzania | $0.10 |
| 84 | 🇸🇿 Swaziland | $0.10 |
| 85 | 🇪🇨 Ecuador | $0.10 |
| 86 | 🇧🇼 Botswana | $0.10 |
| 87 | 🇩🇴 Dominican Republic | $0.10 |
| 88 | 🇲🇰 Northern Macedonia | $0.10 |
| 89 | 🇦🇱 Albania | $0.10 |
| 90 | 🇱🇸 Lesotho | $0.09 |
| 91 | 🇸🇱 Sierra Leone | $0.09 |
| 92 | 🇮🇩 Indonesia | $0.09 |
| 93 | 🇧🇾 Belarus | $0.09 |
| 94 | 🇭🇺 Hungary | $0.09 |
| 95 | 🇧🇦 Bosnia & Herzegovina | $0.09 |
| 96 | 🇹🇼 Taiwan | $0.09 |
| 97 | 🇰🇷 South Korea | $0.09 |
| 98 | 🇲🇽 Mexico | $0.09 |
| 99 | 🇷🇸 Serbia | $0.09 |
| 100 | 🇨🇩 DR Congo | $0.08 |
Source: GlobalPetrolPrices.com. As of March 31, 2022. Represents average household prices.
In the U.S., consumer electricity prices have increased nearly 16% annually compared to September last year, the highest increase in over four decades, fueling higher inflation.
However, households are more sheltered from the impact of Russian supply disruptions due to the U.S. being a net exporter of energy.
3. Global Energy Prices: Natural Gas
Eight of the 10 highest natural gas prices globally fall in Europe, with the Netherlands at the top. Overall, European natural gas prices have spiked sixfold in a year since the invasion of Ukraine.
| Rank | Country/ Region | Natural Gas Prices (kWh, USD) |
|---|---|---|
| 1 | 🇳🇱 Netherlands | $0.41 |
| 2 | 🇸🇪 Sweden | $0.24 |
| 3 | 🇩🇪 Germany | $0.21 |
| 4 | 🇧🇷 Brazil | $0.20 |
| 5 | 🇩🇰 Denmark | $0.19 |
| 6 | 🇪🇸 Spain | $0.17 |
| 7 | 🇮🇹 Italy | $0.16 |
| 8 | 🇦🇹 Austria | $0.16 |
| 9 | 🇸🇬 Singapore | $0.15 |
| 10 | 🇧🇪 Belgium | $0.15 |
| 11 | 🇭🇰 Hong Kong | $0.14 |
| 12 | 🇨🇿 Czech Republic | $0.14 |
| 13 | 🇬🇷 Greece | $0.12 |
| 14 | 🇫🇷 France | $0.12 |
| 15 | 🇯🇵 Japan | $0.11 |
| 16 | 🇬🇧 United Kingdom | $0.10 |
| 17 | 🇨🇭 Switzerland | $0.10 |
| 18 | 🇨🇱 Chile | $0.10 |
| 19 | 🇵🇹 Portugal | $0.09 |
| 20 | 🇧🇧 Barbados | $0.09 |
| 21 | 🇵🇱 Poland | $0.09 |
| 22 | 🇧🇬 Bulgaria | $0.09 |
| 23 | 🇮🇪 Ireland | $0.08 |
| 24 | 🇦🇺 Australia | $0.07 |
| 25 | 🇲🇽 Mexico | $0.07 |
| 26 | 🇳🇿 New Zealand | $0.06 |
| 27 | 🇸🇰 Slovakia | $0.06 |
| 28 | 🇺🇲 U.S. | $0.05 |
| 29 | 🇰🇷 South Korea | $0.04 |
| 30 | 🇨🇴 Colombia | $0.04 |
| 31 | 🇨🇦 Canada | $0.03 |
| 32 | 🇷🇸 Serbia | $0.03 |
| 33 | 🇹🇼 Taiwan | $0.03 |
| 34 | 🇺🇦 Ukraine | $0.03 |
| 35 | 🇲🇾 Malaysia | $0.03 |
| 36 | 🇭🇺 Hungary | $0.03 |
| 37 | 🇹🇳 Tunisia | $0.02 |
| 38 | 🇦🇿 Azerbaijan | $0.01 |
| 39 | 🇧🇭 Bahrain | $0.01 |
| 40 | 🇧🇩 Bangladesh | $0.01 |
| 41 | 🇹🇷 Turkey | $0.01 |
| 42 | 🇷🇺 Russia | $0.01 |
| 43 | 🇦🇷 Argentina | $0.01 |
| 44 | 🇧🇾 Belarus | $0.01 |
| 45 | 🇩🇿 Algeria | $0.003 |
| 46 | 🇮🇷 Iran | $0.001 |
Source: GlobalPetrolPrices.com. As of March 31, 2022. Represents average household prices.
The good news is that the fall season has been relatively warm, which has helped European natural gas demand drop 22% in October compared to last year. This helps reduce the risk of gas shortages transpiring later in the winter.
Outside of Europe, Brazil has the fourth highest natural gas prices globally, despite producing about half of its supply domestically. High costs of cooking gas have been especially challenging for low-income families, which became a key political issue in the run-up to the presidential election in October.
Meanwhile, Singapore has the highest natural gas prices in Asia as the majority is imported via tankers or pipelines, leaving the country vulnerable to price shocks.
Increasing Competition
By December, all seaborne crude oil shipments from Russia to Europe will come to a halt, likely pushing up gasoline prices into the winter and 2023.
Concerningly, analysis from the EIA shows that European natural gas storage capacities could sink to 20% by February if Russia completely shuts off its supply and demand is not reduced.
As Europe seeks out alternatives to Russian energy, higher demand could increase global competition for fuel sources, driving up prices for energy in the coming months ahead.
Still, there is some room for optimism: the World Bank projects energy prices will decline 11% in 2023 after the 60% rise seen after the war in Ukraine in 2022.


Energy Shift
The World’s Biggest Oil Producers in 2023
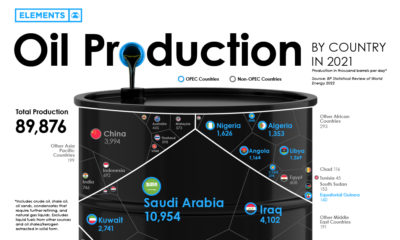
Just three countries accounted for 40% of global oil production last year.

The World’s Biggest Oil Producers in 2023
This was originally posted on our Voronoi app. Download the app for free on iOS or Android and discover incredible data-driven charts from a variety of trusted sources.
Despite efforts to decarbonize the global economy, oil still remains one of the world’s most important resources. It’s also produced by a fairly limited group of countries, which can be a source of economic and political leverage.
This graphic illustrates global crude oil production in 2023, measured in million barrels per day, sourced from the U.S. Energy Information Administration (EIA).
Three Countries Account for 40% of Global Oil Production
In 2023, the United States, Russia, and Saudi Arabia collectively contributed 32.7 million barrels per day to global oil production.
| Oil Production 2023 | Million barrels per day |
|---|---|
| 🇺🇸 U.S. | 12.9 |
| 🇷🇺 Russia | 10.1 |
| 🇸🇦 Saudi Arabia | 9.7 |
| 🇨🇦 Canada | 4.6 |
| 🇮🇶 Iraq | 4.3 |
| 🇨🇳 China | 4.2 |
| 🇮🇷 Iran | 3.6 |
| 🇧🇷 Brazil | 3.4 |
| 🇦🇪 UAE | 3.4 |
| 🇰🇼 Kuwait | 2.7 |
| 🌍 Other | 22.8 |
These three nations have consistently dominated oil production since 1971. The leading position, however, has alternated among them over the past five decades.
In contrast, the combined production of the next three largest producers—Canada, Iraq, and China—reached 13.1 million barrels per day in 2023, just surpassing the production of the United States alone.
In the near term, no country is likely to surpass the record production achieved by the U.S. in 2023, as no other producer has ever reached a daily capacity of 13.0 million barrels. Recently, Saudi Arabia’s state-owned Saudi Aramco scrapped plans to increase production capacity to 13.0 million barrels per day by 2027.
In 2024, analysts forecast that the U.S. will maintain its position as the top oil producer. In fact, according to Macquarie Group, U.S. oil production is expected to achieve a record pace of about 14 million barrels per day by the end of the year.
Energy Shift
How Much Does the U.S. Depend on Russian Uranium?
Despite a new uranium ban being discussed in Congress, the U.S. is still heavily dependent on Russian uranium.

How Much Does the U.S. Depend on Russian Uranium?
This was originally posted on our Voronoi app. Download the app for free on iOS or Android and discover incredible data-driven charts from a variety of trusted sources.
The U.S. House of Representatives recently passed a ban on imports of Russian uranium. The bill must pass the Senate before becoming law.
In this graphic, we visualize how much the U.S. relies on Russian uranium, based on data from the United States Energy Information Administration (EIA).
U.S. Suppliers of Enriched Uranium
After Russia invaded Ukraine, the U.S. imposed sanctions on Russian-produced oil and gas—yet Russian-enriched uranium is still being imported.
Currently, Russia is the largest foreign supplier of nuclear power fuel to the United States. In 2022, Russia supplied almost a quarter of the enriched uranium used to fuel America’s fleet of more than 90 commercial reactors.
| Country of enrichment service | SWU* | % |
|---|---|---|
| 🇺🇸 United States | 3,876 | 27.34% |
| 🇷🇺 Russia | 3,409 | 24.04% |
| 🇩🇪 Germany | 1,763 | 12.40% |
| 🇬🇧 United Kingdom | 1,593 | 11.23% |
| 🇳🇱 Netherlands | 1,303 | 9.20% |
| Other | 2,232 | 15.79% |
| Total | 14,176 | 100% |
SWU stands for “Separative Work Unit” in the uranium industry. It is a measure of the amount of work required to separate isotopes of uranium during the enrichment process. Source: U.S. Energy Information Administration
Most of the remaining uranium is imported from European countries, while another portion is produced by a British-Dutch-German consortium operating in the United States called Urenco.
Similarly, nearly a dozen countries around the world depend on Russia for more than half of their enriched uranium—and many of them are NATO-allied members and allies of Ukraine.
In 2023 alone, the U.S. nuclear industry paid over $800 million to Russia’s state-owned nuclear energy corporation, Rosatom, and its fuel subsidiaries.
It is important to note that 19% of electricity in the U.S. is powered by nuclear plants.
The dependency on Russian fuels dates back to the 1990s when the United States turned away from its own enrichment capabilities in favor of using down-blended stocks of Soviet-era weapons-grade uranium.
As part of the new uranium-ban bill, the Biden administration plans to allocate $2.2 billion for the expansion of uranium enrichment facilities in the United States.

-

 Electrification3 years ago
Ranked: The Top 10 EV Battery Manufacturers
-

 Electrification2 years ago
The Key Minerals in an EV Battery
-

 Real Assets3 years ago
The World’s Top 10 Gold Mining Companies
-

 Misc3 years ago
All the Metals We Mined in One Visualization
-

 Electrification3 years ago
The Biggest Mining Companies in the World in 2021
-

 Energy Shift2 years ago
What Are the Five Major Types of Renewable Energy?
-

 Electrification2 years ago
Mapped: Solar Power by Country in 2021
-

 Electrification2 years ago
The World’s Largest Nickel Mining Companies