

Energy Shift
Visualizing the Rise of the U.S. as Top Crude Oil Producer
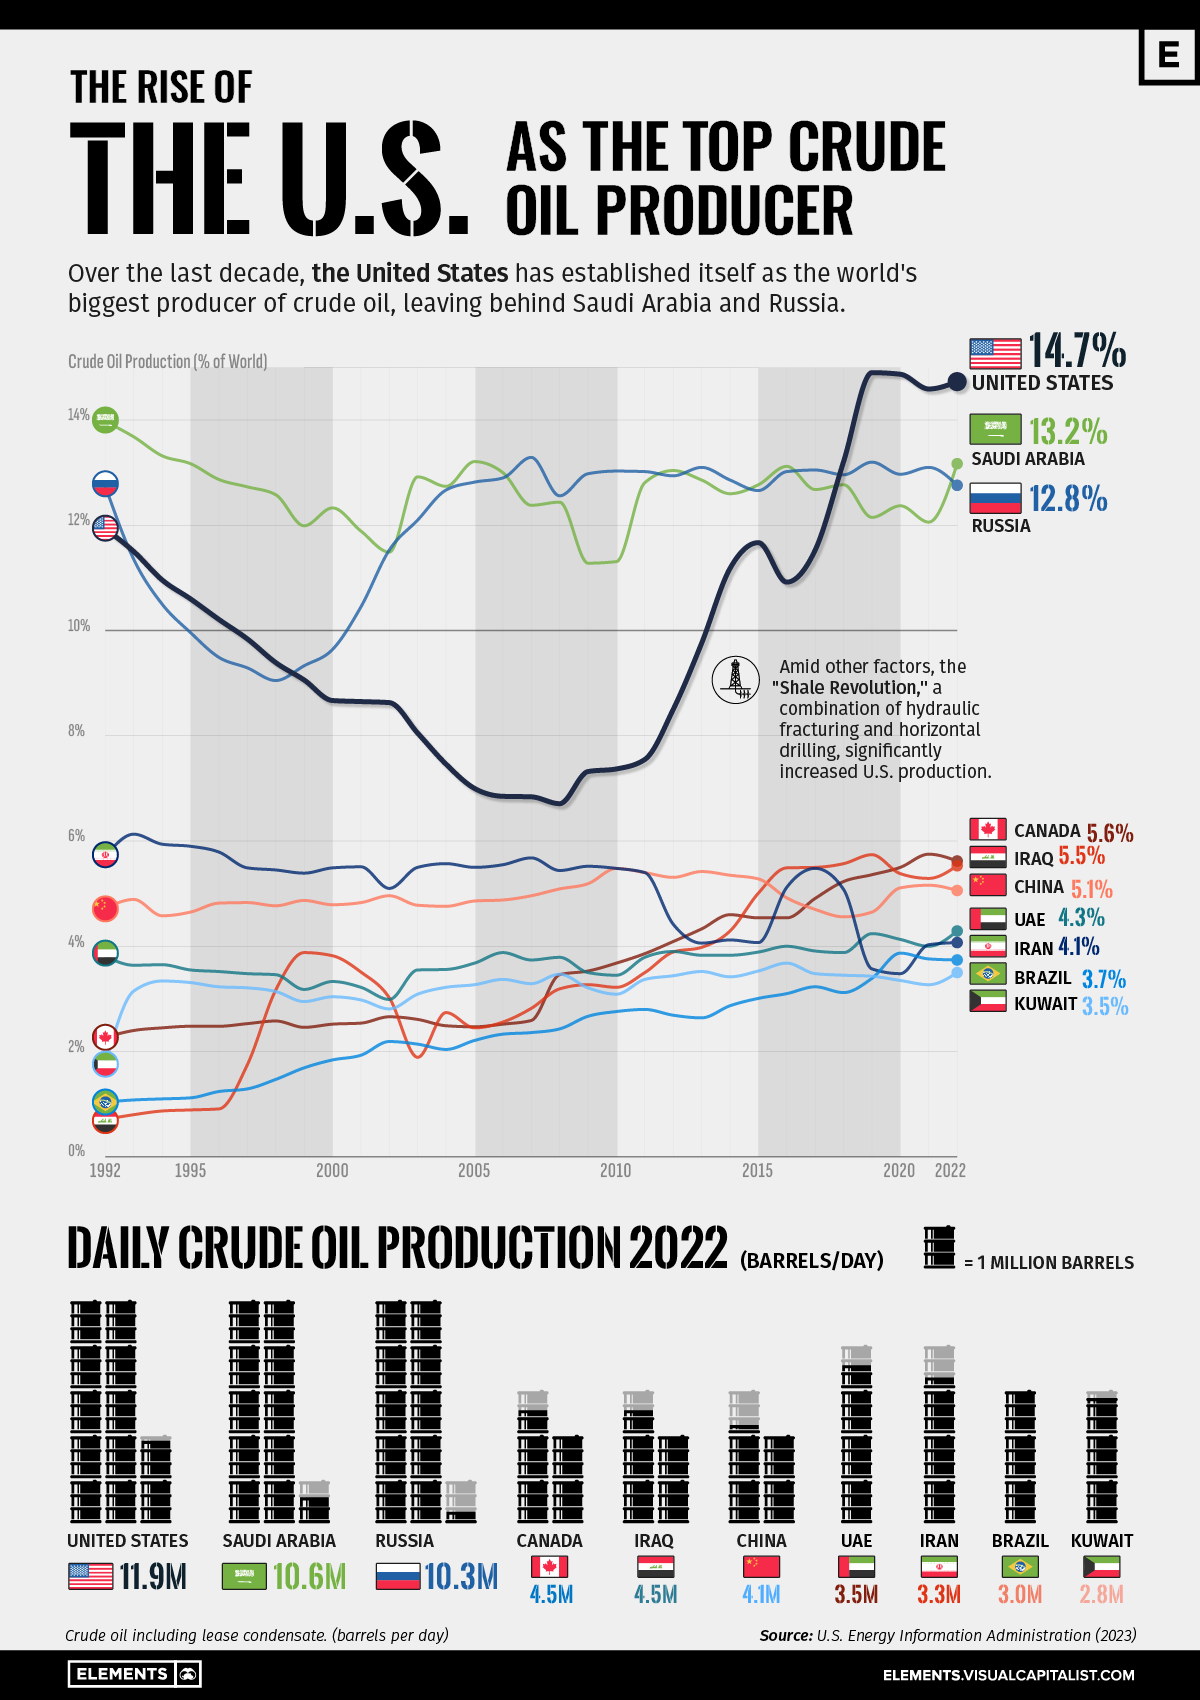
Visualizing the Rise of the U.S. as Top Crude Oil Producer
Over the last decade, the United States has established itself as the world’s top producer of crude oil, surpassing Saudi Arabia and Russia.
This infographic illustrates the rise of the U.S. as the biggest oil producer, based on data from the U.S. Energy Information Administration (EIA).
U.S. Takes Lead in 2018
Over the last three decades, the United States, Saudi Arabia, and Russia have alternated as the top crude producers, but always by small margins.
During the 1990s, Saudi Arabia dominated crude production, taking advantage of its extensive oil reserves. The petroleum sector accounts for roughly 42% of the country’s GDP, 87% of its budget revenues, and 90% of export earnings.
However, during the 2000s, Russia surpassed Saudi Arabia in production during some years, following strategic investments in expanding its oil infrastructure. The majority of Russia’s oil goes to OECD Europe (60%), with around 20% going to China.
| Crude Oil Production | United States | Saudi Arabia | Russia |
|---|---|---|---|
| 1992 | 11.93% | 13.97% | 12.74% |
| 1993 | 11.50% | 13.68% | 11.35% |
| 1994 | 10.96% | 13.32% | 10.50% |
| 1995 | 10.60% | 13.17% | 9.96% |
| 1996 | 10.21% | 12.87% | 9.49% |
| 1997 | 9.84% | 12.73% | 9.29% |
| 1998 | 9.39% | 12.58% | 9.05% |
| 1999 | 9.06% | 11.99% | 9.33% |
| 2000 | 8.67% | 12.33% | 9.64% |
| 2001 | 8.65% | 11.89% | 10.45% |
| 2002 | 8.63% | 11.49% | 11.53% |
| 2003 | 8.05% | 12.92% | 12.10% |
| 2004 | 7.46% | 12.74% | 12.67% |
| 2005 | 7.00% | 13.21% | 12.82% |
| 2006 | 6.85% | 13.00% | 12.90% |
| 2007 | 6.84% | 12.38% | 13.29% |
| 2008 | 6.71% | 12.44% | 12.56% |
| 2009 | 7.32% | 11.28% | 12.98% |
| 2010 | 7.37% | 11.31% | 13.03% |
| 2011 | 7.55% | 12.81% | 13.02% |
| 2012 | 8.50% | 13.04% | 12.94% |
| 2013 | 9.76% | 12.86% | 13.10% |
| 2014 | 11.18% | 12.60% | 12.86% |
| 2015 | 11.67% | 12.77% | 12.66% |
| 2016 | 10.92% | 13.12% | 13.02% |
| 2017 | 11.53% | 12.68% | 13.05% |
| 2018 | 13.21% | 12.77% | 12.96% |
| 2019 | 14.90% | 12.15% | 13.20% |
| 2020 | 14.87% | 12.37% | 12.97% |
| 2021 | 14.59% | 12.06% | 13.10% |
| 2022 | 14.73% | 13.17% | 12.76% |
Over the 2010s, the U.S. witnessed an increase in domestic production, much of it attributable to hydraulic fracturing, or “fracking,” in the shale formations ranging from Texas to North Dakota. It became the world’s largest oil producer in 2018, outproducing Russia and Saudi Arabia.
The U.S. accounted for 14.7% of crude oil production worldwide in 2022, compared to 13.1% for Saudi Arabia and 12.7% for Russia.
Despite leading petroleum production, the U.S. still trails seven countries in remaining proven reserves underground, with 55,251 million barrels.
Venezuela has the biggest reserves with 303,221 million barrels. Saudi Arabia, with 267,192 million barrels, occupies the second spot, while Russia is seventh with 80,000 million barrels.


Energy Shift
Visualizing Copper Production by Country in 2023
Chile and Peru account for one-third of the world’s copper output.

Visualizing Copper Production by Country in 2023
This was originally posted on our Voronoi app. Download the app for free on iOS or Android and discover incredible data-driven charts from a variety of trusted sources.
Copper is considered an essential metal for the clean energy transition because it is a great conductor of electricity.
As a result, governments around the world have been encouraging the construction of new mines, and mining companies have been seeking new projects and acquiring existing mines to meet the growing demand.
In this graphic, we illustrate global copper production in 2023, based on data from the U.S. Geological Survey, Mineral Commodity Summaries, as of January 2024.
Most Copper Comes from South America
Chile and Peru account for one-third of the world’s copper output.
| Country | Region | 2023E Production (Million tonnes) |
|---|---|---|
| 🇨🇱 Chile | South America | 5.0 |
| 🇵🇪 Peru | South America | 2.6 |
| 🇨🇩 Congo (Kinshasa) | Africa | 2.5 |
| 🇨🇳 China | Asia | 1.7 |
| 🇺🇸 United States | North America | 1.1 |
| 🇷🇺 Russia | Europe/Asia | 0.9 |
| 🇦🇺 Australia | Oceania | 0.8 |
| 🇮🇩 Indonesia | Asia | 0.8 |
| 🇿🇲 Zambia | Africa | 0.8 |
| 🇲🇽 Mexico | North America | 0.7 |
| 🇰🇿 Kazakhstan | Asia | 0.6 |
| 🇨🇦 Canada | North America | 0.5 |
| 🇵🇱 Poland | Europe | 0.4 |
| 🌍 Rest of World | -- | 3.1 |
| World total (rounded) | -- | 21.5 |
Chile is also home to the two largest mines in the world, Escondida and Collahuasi.
Meanwhile, African countries have rapidly increased their production. The Democratic Republic of Congo, for example, transitioned from being a secondary copper producer in the late 1990s to becoming the third-largest producer by 2023.
Part of the growth in copper mining in Africa is attributed to high investment from China. Chinese mining companies represent 8% of Africa’s total output in the mining sector.
Within its territory, China has also seen a 277% growth in copper production over the last three decades.
In the U.S., Arizona is the leading copper-producing state, accounting for approximately 70% of domestic output. Copper is also mined in Michigan, Missouri, Montana, Nevada, New Mexico, and Utah.
Energy Shift
Who’s Building the Most Solar Energy?
China’s solar capacity triples USA, nearly doubles EU.

Who’s Building the Most Solar Energy?
This was originally posted on our Voronoi app. Download the app for free on iOS or Android and discover incredible data-driven charts from a variety of trusted sources.
In 2023, solar energy accounted for three-quarters of renewable capacity additions worldwide. Most of this growth occurred in Asia, the EU, and the U.S., continuing a trend observed over the past decade.
In this graphic, we illustrate the rise in installed solar photovoltaic (PV) capacity in China, the EU, and the U.S. between 2010 and 2022, measured in gigawatts (GW). Bruegel compiled the data..
Chinese Dominance
As of 2022, China’s total installed capacity stands at 393 GW, nearly double that of the EU’s 205 GW and surpassing the USA’s total of 113 GW by more than threefold in absolute terms.
| Installed solar capacity (GW) | China | EU27 | U.S. |
|---|---|---|---|
| 2022 | 393.0 | 205.5 | 113.0 |
| 2021 | 307.0 | 162.7 | 95.4 |
| 2020 | 254.0 | 136.9 | 76.4 |
| 2019 | 205.0 | 120.1 | 61.6 |
| 2018 | 175.3 | 104.0 | 52.0 |
| 2017 | 130.8 | 96.2 | 43.8 |
| 2016 | 77.8 | 91.5 | 35.4 |
| 2015 | 43.6 | 87.7 | 24.2 |
| 2014 | 28.4 | 83.6 | 18.1 |
| 2013 | 17.8 | 79.7 | 13.3 |
| 2012 | 6.7 | 71.1 | 8.6 |
| 2011 | 3.1 | 53.3 | 5.6 |
| 2010 | 1.0 | 30.6 | 3.4 |
Since 2017, China has shown a compound annual growth rate (CAGR) of approximately 25% in installed PV capacity, while the USA has seen a CAGR of 21%, and the EU of 16%.
Additionally, China dominates the production of solar power components, currently controlling around 80% of the world’s solar panel supply chain.
In 2022, China’s solar industry employed 2.76 million individuals, with manufacturing roles representing approximately 1.8 million and the remaining 918,000 jobs in construction, installation, and operations and maintenance.
The EU industry employed 648,000 individuals, while the U.S. reached 264,000 jobs.
According to the IEA, China accounts for almost 60% of new renewable capacity expected to become operational globally by 2028.
Despite the phasing out of national subsidies in 2020 and 2021, deployment of solar PV in China is accelerating. The country is expected to reach its national 2030 target for wind and solar PV installations in 2024, six years ahead of schedule.

-

 Electrification3 years ago
Ranked: The Top 10 EV Battery Manufacturers
-

 Electrification2 years ago
The Key Minerals in an EV Battery
-

 Real Assets3 years ago
The World’s Top 10 Gold Mining Companies
-

 Electrification2 years ago
Mapped: Solar Power by Country in 2021
-

 Misc3 years ago
All the Metals We Mined in One Visualization
-

 Energy Shift2 years ago
What Are the Five Major Types of Renewable Energy?
-

 Electrification2 years ago
The World’s Largest Nickel Mining Companies
-

 Misc3 years ago
The Largest Copper Mines in the World by Capacity