

Real Assets
Visualizing Global Gold Production by Country in 2020
Global Gold Production by Country in 2020
People usually come across gold in the form of jewelry and admire it for its beauty, value, and permanence.
But before gold makes it into jewelry and vaults, it goes through a long and difficult production process that begins with mining.
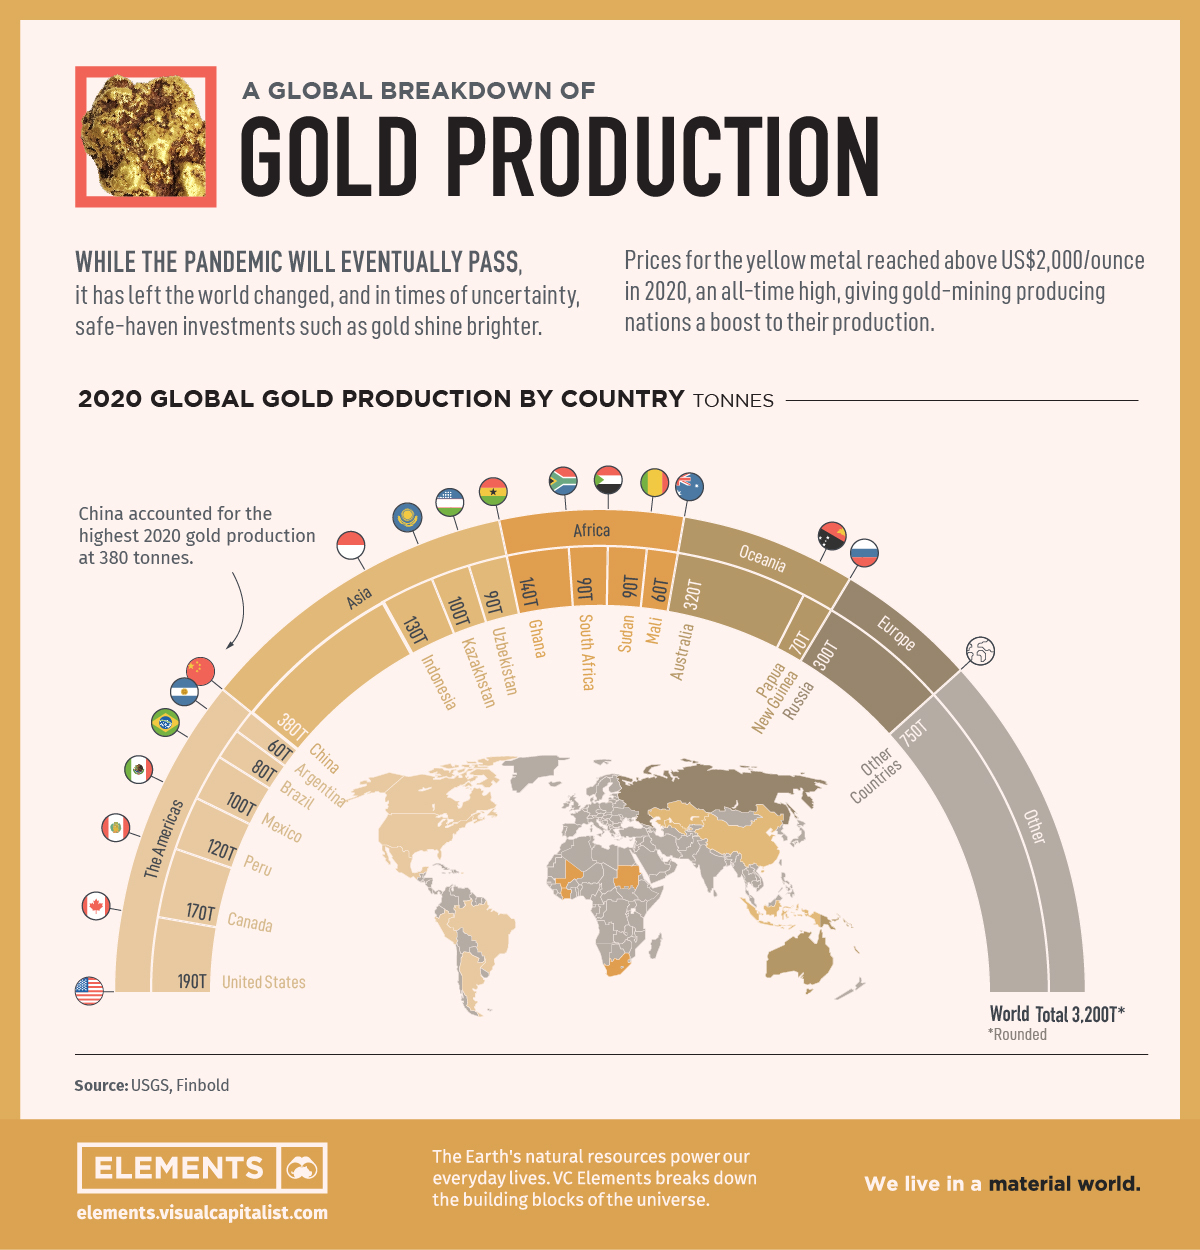
The price of gold broke an all-time high of $2,000/oz in 2020, giving miners a brief boost to profitability. However, mine shutdowns due to the pandemic ultimately dented global gold production relative to 2019.
The above infographic breaks down gold production by country in 2020, highlighting the biggest nations for gold mining.
The Top 10 Gold Producing Countries
Although gold mining is a global business, just three countries—China, Australia, and Russia—accounted for 31% of global gold production in 2020.
| Country | 2020 Production (tonnes) | % of Total |
|---|---|---|
| 🇨🇳 China | 380 | 11.7% |
| 🇦🇺 Australia | 320 | 9.9% |
| 🇷🇺 Russia | 300 | 9.3% |
| 🇺🇸 U.S. | 190 | 5.9% |
| 🇨🇦 Canada | 170 | 5.2% |
| 🇬🇭 Ghana | 140 | 4.3% |
| 🇮🇩 Indonesia | 130 | 4.0% |
| 🇵🇪 Peru | 120 | 3.7% |
| 🇰🇿 Kazakhstan | 100 | 3.1% |
| 🇲🇽 Mexico | 100 | 3.1% |
| 🇺🇿 Uzbekistan | 90 | 2.8% |
| 🇿🇦 South Africa | 90 | 2.8% |
| 🇸🇩 Sudan | 90 | 2.8% |
| 🇧🇷 Brazil | 80 | 2.5% |
| 🇵🇬 Papua New Guinea | 70 | 2.2% |
| 🇲🇱 Mali | 61 | 1.9% |
| 🇦🇷 Argentina | 60 | 1.9% |
| Other | 750 | 23.1% |
| Total | 3,241 | 100.0% |
China topped the list partly due to the resumption of gold mining activities after pandemic-induced lockdowns. Furthermore, China accounted for 30% of global demand for gold jewelry in 2020, offering miners an additional incentive for production.
The U.S. produced 190 tonnes of gold in 2020, the majority of which came from mines in Nevada. Barrick Gold, the world’s largest gold mining company, produced roughly 85 tonnes or 45% of U.S. gold in 2020.
Indonesia ranks seventh in the list partly due to the Grasberg Mine, one of the world’s largest gold mines, which has produced over 1,500 tonnes or 53 million ounces of gold since 1990.
In total, miners produced 3,241 tonnes of gold in 2020, a 3% drop from the 3,300 tonnes mined in 2019. This also brings the total above-ground stocks of gold to around 201,296 tonnes, which are distributed between jewelry, investments, and central bank holdings.
How Much Gold is Left to Mine?
Gold derives part of its value from scarcity. So how much gold is left in the world?
According to the World Gold Council, the latest year-end estimate of underground gold reserves adds up to 50,000 tonnes. Of these, Australia and Russia collectively host around 35% or 17,500 tonnes.
At current production rates, these gold reserves will last less than 16 years. However, 2020 also saw $2.9 billion flow into gold exploration and development projects, which might one day add to the world’s gold reserves in the future.


Real Assets
Visualizing Global Gold Production in 2023
Gold production in 2023 was led by China, Australia, and Russia, with each outputting over 300 tonnes.
Visualizing Global Gold Production in 2023
This was originally posted on our Voronoi app. Download the app for free on iOS or Android and discover incredible data-driven charts from a variety of trusted sources.
Over 3,000 tonnes of gold were produced globally in 2023.
In this graphic, we list the world’s leading countries in terms of gold production. These figures come from the latest USGS publication on gold statistics (published January 2024).
China, Australia, and Russia Produced the Most Gold in 2023
China was the top producer in 2023, responsible for over 12% of total global production, followed by Australia and Russia.
| Country | Region | 2023E Production (tonnes) |
|---|---|---|
| 🇨🇳 China | Asia | 370 |
| 🇦🇺 Australia | Oceania | 310 |
| 🇷🇺 Russia | Europe | 310 |
| 🇨🇦 Canada | North America | 200 |
| 🇺🇸 United States | North America | 170 |
| 🇰🇿 Kazakhstan | Asia | 130 |
| 🇲🇽 Mexico | North America | 120 |
| 🇮🇩 Indonesia | Asia | 110 |
| 🇿🇦 South Africa | Africa | 100 |
| 🇺🇿 Uzbekistan | Asia | 100 |
| 🇬🇭 Ghana | Africa | 90 |
| 🇵🇪 Peru | South America | 90 |
| 🇧🇷 Brazil | South America | 60 |
| 🇧🇫 Burkina Faso | Africa | 60 |
| 🇲🇱 Mali | Africa | 60 |
| 🇹🇿 Tanzania | Africa | 60 |
| 🌍 Rest of World | - | 700 |
Gold mines in China are primarily concentrated in eastern provinces such as Shandong, Henan, Fujian, and Liaoning. As of January 2024, China’s gold mine reserves stand at an estimated 3,000 tonnes, representing around 5% of the global total of 59,000 tonnes.
In addition to being the top producer, China emerged as the largest buyer of the yellow metal for the year. In fact, the country’s central bank alone bought 225 tonnes of gold in 2023, according the World Gold Council.
Estimated Global Gold Consumption
Most of the gold produced in 2023 was used in jewelry production, while another significant portion was sold as a store of value, such as in gold bars or coins.
- Jewelry: 46%
- Central Banks and Institutions: 23%
- Physical Bars: 16%
- Official Coins, Medals, and Imitation Coins: 9%
- Electrical and Electronics: 5%
- Other: 1%
According to Fitch Solutions, over the medium term (2023-2032), global gold mine production is expected to grow 15%, as high prices encourage investment and output.
Real Assets
Charted: The Value Gap Between the Gold Price and Gold Miners
While gold prices hit all-time highs, gold mining stocks have lagged far behind.

Gold Price vs. Gold Mining Stocks
This was originally posted on our Voronoi app. Download the app for free on Apple or Android and discover incredible data-driven charts from a variety of trusted sources.
Although the price of gold has reached new record highs in 2024, gold miners are still far from their 2011 peaks.
In this graphic, we illustrate the evolution of gold prices since 2000 compared to the NYSE Arca Gold BUGS Index (HUI), which consists of the largest and most widely held public gold production companies. The data was compiled by Incrementum AG.
Mining Stocks Lag Far Behind
In April 2024, gold reached a new record high as Federal Reserve Chair Jerome Powell signaled policymakers may delay interest rate cuts until clearer signs of declining inflation materialize.
Additionally, with elections occurring in more than 60 countries in 2024 and ongoing conflicts in Ukraine and Gaza, central banks are continuing to buy gold to strengthen their reserves, creating momentum for the metal.
Traditionally known as a hedge against inflation and a safe haven during times of political and economic uncertainty, gold has climbed over 11% so far this year.
According to Business Insider, gold miners experienced their best performance in a year in March 2024. During that month, the gold mining sector outperformed all other U.S. industries, surpassing even the performance of semiconductor stocks.
Still, physical gold has outperformed shares of gold-mining companies over the past three years by one of the largest margins in decades.
| Year | Gold Price | NYSE Arca Gold BUGS Index (HUI) |
|---|---|---|
| 2023 | $2,062.92 | $243.31 |
| 2022 | $1,824.32 | $229.75 |
| 2021 | $1,828.60 | $258.87 |
| 2020 | $1,895.10 | $299.64 |
| 2019 | $1,523.00 | $241.94 |
| 2018 | $1,281.65 | $160.58 |
| 2017 | $1,296.50 | $192.31 |
| 2016 | $1,151.70 | $182.31 |
| 2015 | $1,060.20 | $111.18 |
| 2014 | $1,199.25 | $164.03 |
| 2013 | $1,201.50 | $197.70 |
| 2012 | $1,664.00 | $444.22 |
| 2011 | $1,574.50 | $498.73 |
| 2010 | $1,410.25 | $573.32 |
| 2009 | $1,104.00 | $429.91 |
| 2008 | $865.00 | $302.41 |
| 2007 | $836.50 | $409.37 |
| 2006 | $635.70 | $338.24 |
| 2005 | $513.00 | $276.90 |
| 2004 | $438.00 | $215.33 |
| 2003 | $417.25 | $242.93 |
| 2002 | $342.75 | $145.12 |
| 2001 | $276.50 | $65.20 |
| 2000 | $272.65 | $40.97 |
Among the largest companies on the NYSE Arca Gold BUGS Index, Colorado-based Newmont has experienced a 24% drop in its share price over the past year. Similarly, Canadian Barrick Gold also saw a decline of 6.5% over the past 12 months.

-

 Electrification3 years ago
Ranked: The Top 10 EV Battery Manufacturers
-

 Electrification2 years ago
The Key Minerals in an EV Battery
-

 Real Assets3 years ago
The World’s Top 10 Gold Mining Companies
-

 Misc3 years ago
All the Metals We Mined in One Visualization
-

 Energy Shift2 years ago
What Are the Five Major Types of Renewable Energy?
-

 Electrification2 years ago
Mapped: Solar Power by Country in 2021
-

 Electrification2 years ago
The World’s Largest Nickel Mining Companies
-

 Electrification3 years ago
How Much Land is Needed to Power the U.S. with Solar?