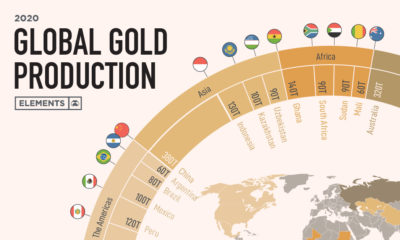

The world produced 3,200 tonnes of gold in 2020, a 3% drop relative to 2019. This graphic breaks down global gold production by country.


The interest income needed to beat inflation since 1994 has varied, but in the last 13 years, savings accounts failed to live up to the task.
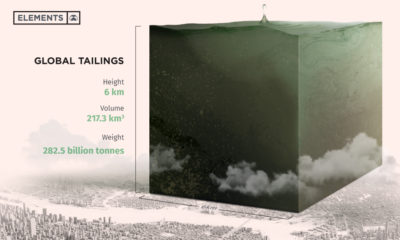

This infographic is a unique look at the estimated 217 billion m³ of mine tailings around the world.
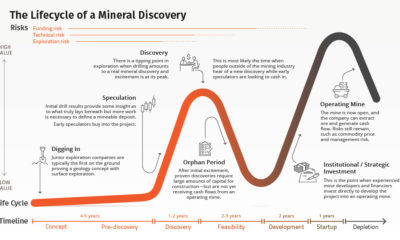

Building a mine takes time that poses risks at every stage. This graphic maps a mineral deposit from discovery to mining, showing where value is created.


