

Electrification
Visualizing 10 Years of Global EV Sales by Country
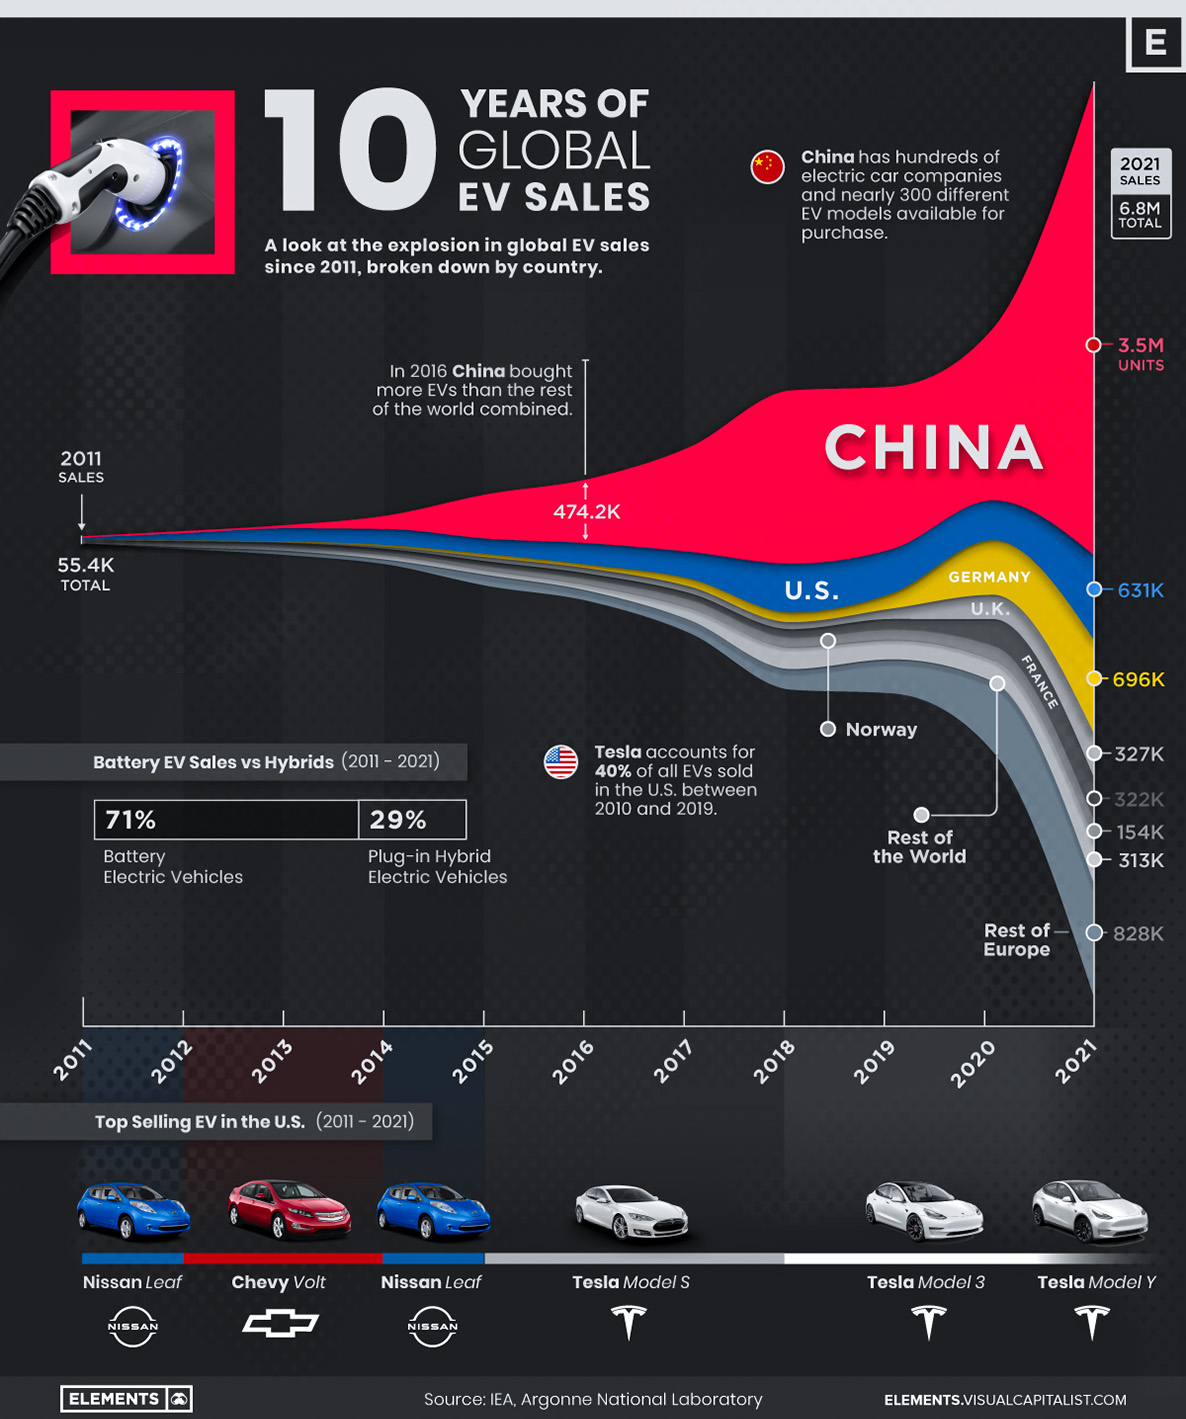


10 Years of EV Sales by Country
In 2011, around 55,000 electric vehicles (EVs) were sold around the world. 10 years later in 2021, that figure had grown close to 7 million vehicles.
With many countries getting plugged into electrification, the global EV market has seen exponential growth over the last decade. Using data from the International Energy Agency (IEA), this infographic shows the explosion in global EV sales since 2011, highlighting the countries that have grown into the biggest EV markets.
The Early EV Days
From 2011 to 2015, global EV sales grew at an average annual rate of 89%, with roughly one-third of global sales occurring in the U.S. alone.
| Year | Total EV Sales | CAGR |
|---|---|---|
| 2011 | 55,414 | - |
| 2012 | 132,013 | 138.2% |
| 2013 | 220,343 | 66.9% |
| 2014 | 361,157 | 63.9% |
| 2015 | 679,235 | 88.0% |
| Total sales / Avg growth | 1,448,162 | 89.3% |
In 2014, the U.S. was the largest EV market followed by China, the Netherlands, Norway, and France. But things changed in 2015, when China’s EV sales grew by 238% relative to 2014, propelling it to the top spot.
China’s growth had been years in the making, with the government offering generous subsidies for electrified cars, in addition to incentives and policies that encouraged production. In 2016, Chinese consumers bought more EVs than the rest of the world combined—and the country hasn’t looked back, accounting for over half of global sales in 2021.
EV Sales by Country in 2021
After remaining fairly flat in 2019, global EV sales grew by 38% in 2020, and then more than doubled in 2021. China was the driver of the growth—the country sold more EVs in 2021 than the rest of the world combined in 2020.
| Country | 2021 EV Sales | % of Total |
|---|---|---|
| China 🇨🇳 | 3,519,054 | 51.7% |
| U.S. 🇺🇸 | 631,152 | 9.3% |
| Germany 🇩🇪 | 695,657 | 10.2% |
| France 🇫🇷 | 322,043 | 4.7% |
| UK 🇬🇧 | 326,990 | 4.8% |
| Norway 🇳🇴 | 153,699 | 2.3% |
| Italy 🇮🇹 | 141,615 | 2.1% |
| Sweden 🇸🇪 | 138,771 | 2.0% |
| South Korea 🇰🇷 | 119,402 | 1.8% |
| Netherlands 🇳🇱 | 97,282 | 1.4% |
| Rest of Europe 🇪🇺 | 469,930 | 6.9% |
| Rest of the World 🌍 | 313,129 | 4.6% |
| Total | 6,809,322 | 100.0% |
China has nearly 300 EV models available for purchase, more than any other country, and it’s also home to four of the world’s 10 largest battery manufacturers. Moreover, the median price of electric cars in China is just 10% more than conventional cars, compared to 45-50% on average in other major markets.
Germany, Europe’s biggest auto market, sold nearly 700,000 EVs in 2021, up 72% from 2020. The country hosts some of the biggest EV factories in Europe, with Tesla, Volkswagen, and Chinese battery giant CATL either planning or operating ‘gigafactories’ there. Overall, sales in Europe increased by 65% in 2021, as evidenced by the seven European countries in the above list.
The U.S. also made a comeback after a two-year drop, with EV sales more than doubling in 2021. The growth was supported by a 24% increase in EV model availability, and also by an increase in production of Tesla models, which accounted for half of U.S. EV sales.
Tesla’s Dominance in the U.S.
Tesla is the world’s most renowned electric car company and its dominance in the U.S. is unmatched.
Between 2011 and 2019, Tesla accounted for 40% of all EVs sold in the United States. Furthermore, Tesla cars have been the top-selling EV models in the U.S. in every year since 2015.
| EV Model | 2021 Sales | % of 2021 U.S. EV Sales |
|---|---|---|
| Tesla Model Y* | 185,994 | 29.5% |
| Tesla Model 3* | 147,460 | 23.4% |
| Ford Mustang Mach-E | 27,140 | 4.3% |
| Chevy Bolt EV/EUV | 24,828 | 3.9% |
| Volkswagen ID.4 | 16,742 | 2.7% |
| Tesla Model S* | 15,545 | 2.5% |
| Nissan Leaf | 14,239 | 2.3% |
| Porsche Taycan | 9,419 | 1.5% |
| Tesla Model X* | 7,985 | 1.3% |
| Audi e-tron | 7,429 | 1.2% |
*Estimates
Share of total sales calculated using total U.S. EV sales of 631,152 units, based on data from the IEA.
Source: Cleantechnica
Tesla accounted for over 50% of EV sales in the U.S. in 2021 with the Model Y—launched in 2019—taking the top spot. Furthermore, the Model Y remained the bestselling EV in the first quarter of 2022, with Tesla taking up a massive 75% of the EV market share.
Despite Tesla’s popularity, it could face a challenge as other automakers roll out new models and expand EV production. For example, General Motors aims to make 20 EV models available by 2025, and Ford expects to produce at least 2 million EVs annually by 2026. This increase in competition from incumbents and new entrants could eat away at Tesla’s market share in the coming years.


Electrification
Ranked: The Top 10 EV Battery Manufacturers in 2023
Asia dominates this ranking of the world’s largest EV battery manufacturers in 2023.

The Top 10 EV Battery Manufacturers in 2023
This was originally posted on our Voronoi app. Download the app for free on iOS or Android and discover incredible data-driven charts from a variety of trusted sources.
Despite efforts from the U.S. and EU to secure local domestic supply, all major EV battery manufacturers remain based in Asia.
In this graphic we rank the top 10 EV battery manufacturers by total battery deployment (measured in megawatt-hours) in 2023. The data is from EV Volumes.
Chinese Dominance
Contemporary Amperex Technology Co. Limited (CATL) has swiftly risen in less than a decade to claim the title of the largest global battery group.
The Chinese company now has a 34% share of the market and supplies batteries to a range of made-in-China vehicles, including the Tesla Model Y, SAIC’s MG4/Mulan, and Li Auto models.
| Company | Country | 2023 Production (megawatt-hour) | Share of Total Production |
|---|---|---|---|
| CATL | 🇨🇳China | 242,700 | 34% |
| BYD | 🇨🇳China | 115,917 | 16% |
| LG Energy Solution | 🇰🇷Korea | 108,487 | 15% |
| Panasonic | 🇯🇵Japan | 56,560 | 8% |
| SK On | 🇰🇷Korea | 40,711 | 6% |
| Samsung SDI | 🇰🇷Korea | 35,703 | 5% |
| CALB | 🇨🇳China | 23,493 | 3% |
| Farasis Energy | 🇨🇳China | 16,527 | 2% |
| Envision AESC | 🇨🇳China | 8,342 | 1% |
| Sunwoda | 🇨🇳China | 6,979 | 1% |
| Other | - | 56,040 | 8% |
In 2023, BYD surpassed LG Energy Solution to claim second place. This was driven by demand from its own models and growth in third-party deals, including providing batteries for the made-in-Germany Tesla Model Y, Toyota bZ3, Changan UNI-V, Venucia V-Online, as well as several Haval and FAW models.
The top three battery makers (CATL, BYD, LG) collectively account for two-thirds (66%) of total battery deployment.
Once a leader in the EV battery business, Panasonic now holds the fourth position with an 8% market share, down from 9% last year. With its main client, Tesla, now effectively sourcing batteries from multiple suppliers, the Japanese battery maker seems to be losing its competitive edge in the industry.
Overall, the global EV battery market size is projected to grow from $49 billion in 2022 to $98 billion by 2029, according to Fortune Business Insights.
Electrification
White Gold: Mapping U.S. Lithium Mines
In this graphic, Visual Capitalist partnerered with EnergyX to explore the size and location of U.S. lithium mines.

White Gold: Mapping U.S. Lithium Mines
The U.S. doubled imports of lithium-ion batteries for the third consecutive year in 2022, and with EV demand growing yearly, U.S. lithium mines must ramp up production or rely on other nations for their supply of refined lithium.
To determine if the domestic U.S. lithium opportunity can meet demand, we partnered with EnergyX to determine how much lithium sits within U.S. borders.
U.S. Lithium Projects
The most crucial measure of a lithium mine’s potential is the quantity that can be extracted from the source.
For each lithium resource, the potential volume of lithium carbonate equivalent (LCE) was calculated with a ratio of one metric ton of lithium producing 5.32 metric tons of LCE. Cumulatively, existing U.S. lithium projects contain 94.8 million metric tons of LCE.
| Rank | Project Name | LCE, million metric tons (est.) |
|---|---|---|
| 1 | McDermitt Caldera | 21.5 |
| 2 | Thacker Pass | 19.1 |
| 3 | Tonopah Flats | 18.0 |
| 4 | TLC Lithium | 10.7 |
| 5 | Clayton Valley (Century Lithium) | 6.3 |
| 6 | Zeus Lithium | 6.3 |
| 7 | Rhyolite Ridge | 3.4 |
| 8 | Arkansas Smackover (Phase 1A) | 2.8 |
| 9 | Basin Project | 2.2 |
| 10 | McGee Deposit | 2.1 |
| 11 | Arkansas Smackover (South West) | 1.8 |
| 12 | Clayton Valley (Lithium-X, Pure Energy) | 0.8 |
| 13 | Big Sandy | 0.3 |
| 14 | Imperial Valley/Salton Sea | 0.3 |
U.S. Lithium Opportunities, By State
U.S. lithium projects mainly exist in western states, with comparatively minor opportunities in central or eastern states.
| State | LCE, million metric tons (est.) |
|---|---|
| Nevada | 88.2 |
| Arkansas | 4.6 |
| Arizona | 2.5 |
| California | 0.3 |
Currently, the U.S. is sitting on a wealth of lithium that it is underutilizing. For context, in 2022, the U.S. only produced about 5,000 metric tons of LCE and imported a projected 19,000 metric tons of LCE, showing that the demand for the mineral is healthy.
The Next Gold Rush?
U.S. lithium companies have the opportunity to become global leaders in lithium production and accelerate the transition to sustainable energy sources. This is particularly important as the demand for lithium is increasing every year.
EnergyX is on a mission to meet U.S. lithium demands using groundbreaking technology that can extract 300% more lithium from a source than traditional methods.
You can take advantage of this opportunity by investing in EnergyX and joining other significant players like GM in becoming a shareholder.


-

 Electrification3 years ago
Ranked: The Top 10 EV Battery Manufacturers
-

 Electrification2 years ago
The Key Minerals in an EV Battery
-

 Real Assets3 years ago
The World’s Top 10 Gold Mining Companies
-

 Misc3 years ago
All the Metals We Mined in One Visualization
-

 Electrification3 years ago
The Biggest Mining Companies in the World in 2021
-

 Energy Shift2 years ago
What Are the Five Major Types of Renewable Energy?
-

 Electrification2 years ago
Mapped: Solar Power by Country in 2021
-

 Electrification2 years ago
The World’s Largest Nickel Mining Companies