

Electrification
Visualized: Battery Vs. Hydrogen Fuel Cell


Battery Electric Vs. Hydrogen Fuel Cell
Since the introduction of the Nissan Leaf (2010) and Tesla Model S (2012), battery-powered electric vehicles (BEVs) have become the primary focus of the automotive industry.
This structural shift is moving at an incredible rate—in China, 3 million BEVs were sold in 2021, up from 1 million the previous year. In the U.S., the number of models available for sale is expected to double by 2024.
In order to meet global climate targets, however, the International Energy Agency claims that the auto industry will require 30 times more minerals per year. Many fear that this could put a strain on supply.
“The data shows a looming mismatch between the world’s strengthened climate ambitions and the availability of critical minerals.”
– Fatih Birol, IEA
Thankfully, BEVs are not the only solution for decarbonizing transportation. In this infographic, we explain how the fuel cell electric vehicle (FCEV) works.
How Does Hydrogen Fuel Cell Work?
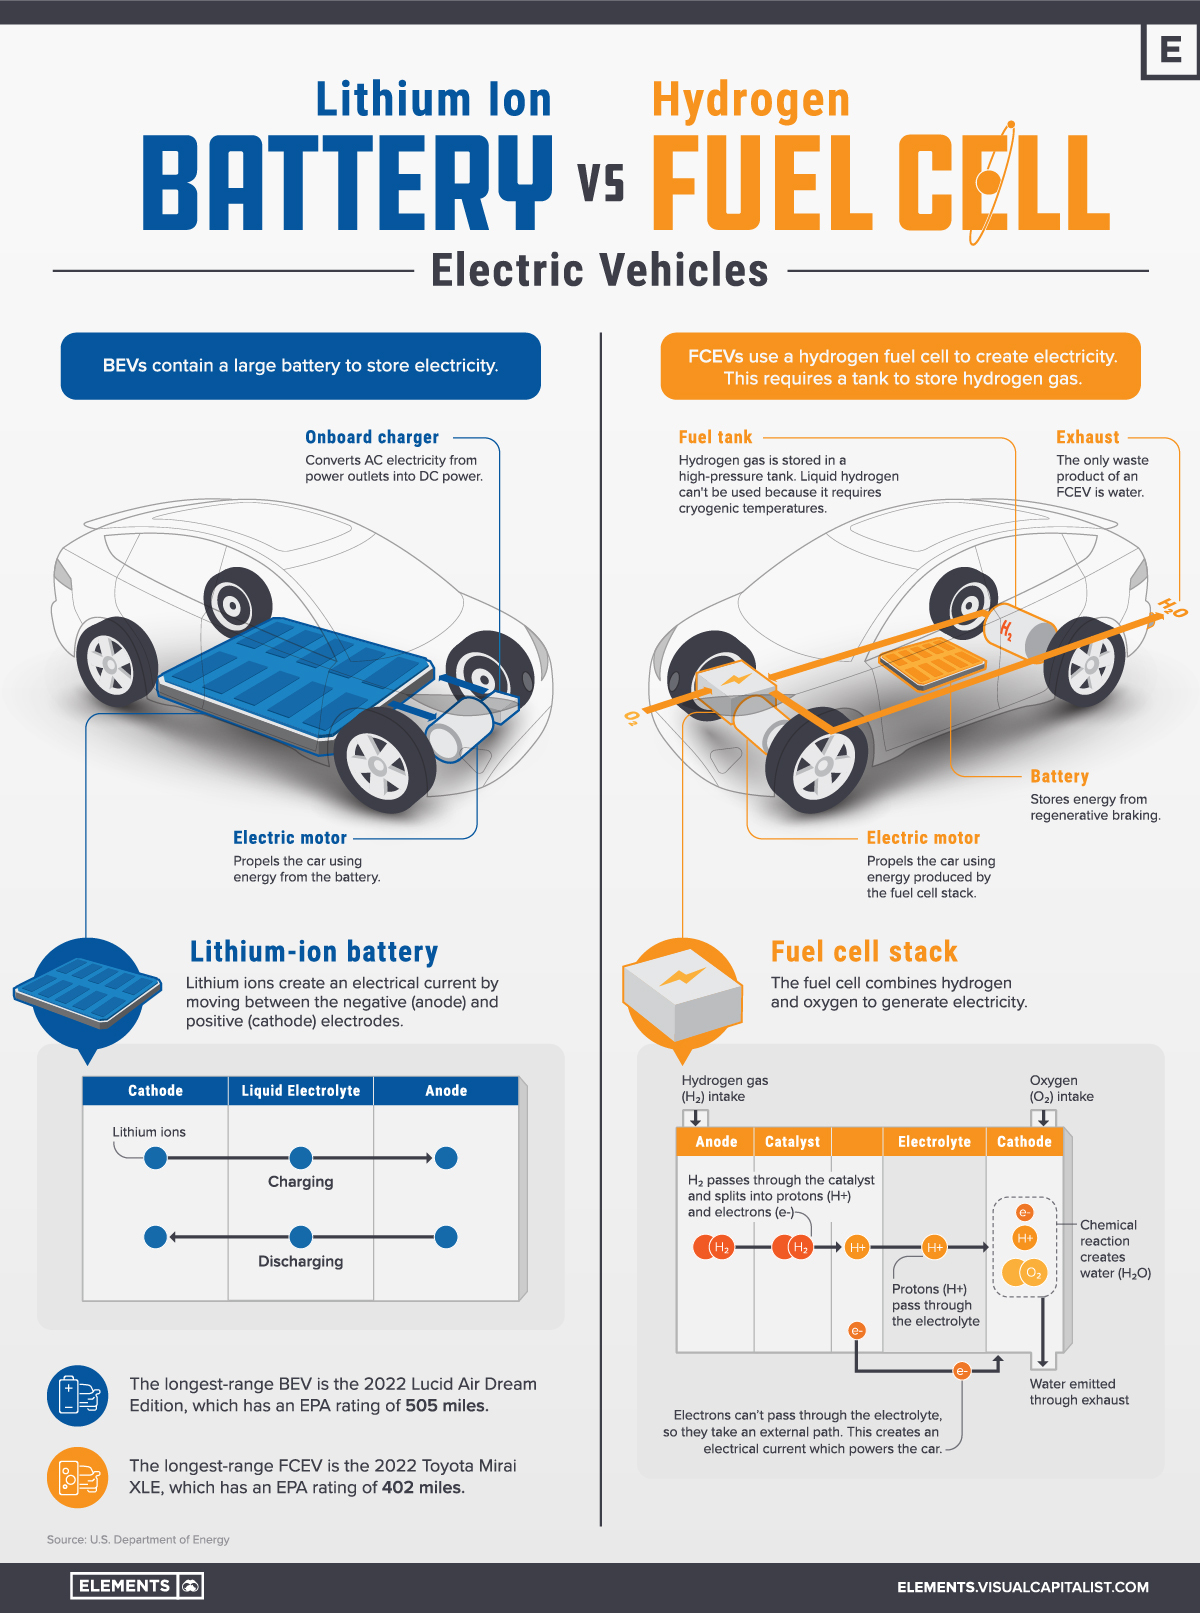
FCEVs are a type of electric vehicle that produces no emissions (aside from the environmental cost of production). The main difference is that BEVs contain a large battery to store electricity, while FCEVs create their own electricity by using a hydrogen fuel cell.
| Major BEV Components | Major FCEV Components |
|---|---|
| Battery | Battery |
| Onboard charger | Hydrogen fuel tank |
| Electric motor | Fuel cell stack |
| Electric motor | |
| Exhaust |
Let’s go over the functions of the major FCEV components.
Battery
First is the lithium-ion battery, which stores electricity to power the electric motor. In an FCEV, the battery is smaller because it’s not the primary power source. For general context, the Model S Plaid contains 7,920 lithium-ion cells, while the Toyota Mirai FCEV contains 330.
Hydrogen Fuel Tank
FCEVs have a fuel tank that stores hydrogen in its gas form. Liquid hydrogen can’t be used because it requires cryogenic temperatures (−150°C or −238°F). Hydrogen gas, along with oxygen, are the two inputs for the hydrogen fuel cell.
Fuel Cell Stack and Motor
The fuel cell uses hydrogen gas to generate electricity. To explain the process in layman’s terms, hydrogen gas passes through the cell and is split into protons (H+) and electrons (e-).
Protons pass through the electrolyte, which is a liquid or gel material. Electrons are unable to pass through the electrolyte, so they take an external path instead. This creates an electrical current to power the motor.
Exhaust
At the end of the fuel cell’s process, the electrons and protons meet together and combine with oxygen. This causes a chemical reaction that produces water (H2O), which is then emitted out of the exhaust pipe.
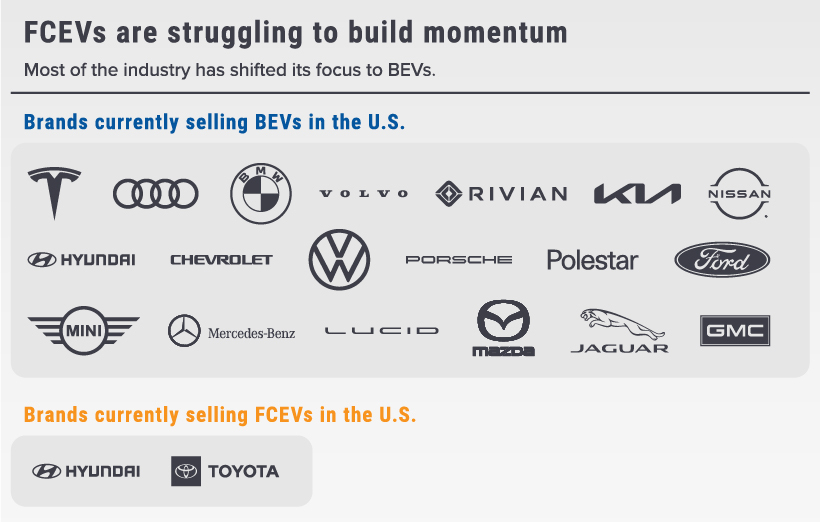
Which Technology is Winning?
As you can see from the table below, most automakers have shifted their focus towards BEVs. Notably missing from the BEV group is Toyota, the world’s largest automaker.
Hydrogen fuel cells have drawn criticism from notable figures in the industry, including Tesla CEO Elon Musk and Volkswagen CEO Herbert Diess.
Green hydrogen is needed for steel, chemical, aero… and should not end up in cars. Far too expensive, inefficient, slow and difficult to rollout and transport.
– Herbert Diess, CEO, Volkswagen Group
Toyota and Hyundai are on the opposing side, as both companies continue to invest in fuel cell development. The difference between them, however, is that Hyundai (and sister brand Kia) has still released several BEVs.
This is a surprising blunder for Toyota, which pioneered hybrid vehicles like the Prius. It’s reasonable to think that after this success, BEVs would be a natural next step. As Wired reports, Toyota placed all of its chips on hydrogen development, ignoring the fact that most of the industry was moving a different way. Realizing its mistake, and needing to buy time, the company has resorted to lobbying against the adoption of EVs.
Confronted with a losing hand, Toyota is doing what most large corporations do when they find themselves playing the wrong game—it’s fighting to change the game.
– Wired
Toyota is expected to release its first BEV, the bZ4X crossover, for the 2023 model year—over a decade since Tesla launched the Model S.
Challenges to Fuel Cell Adoption
Several challenges are standing in the way of widespread FCEV adoption.
One is performance, though the difference is minor. In terms of maximum range, the best FCEV (Toyota Mirai) was EPA-rated for 402 miles, while the best BEV (Lucid Air) received 505 miles.
Two greater issues are 1) hydrogen’s efficiency problem, and 2) a very limited number of refueling stations. According to the U.S. Department of Energy, there are just 48 hydrogen stations across the entire country. 47 are located in California, and 1 is located in Hawaii.
On the contrary, BEVs have 49,210 charging stations nationwide, and can also be charged at home. This number is sure to grow, as the Biden administration has allocated $5 billion for states to expand their charging networks.


Electrification
Ranked: The Top 10 EV Battery Manufacturers in 2023
Asia dominates this ranking of the world’s largest EV battery manufacturers in 2023.

The Top 10 EV Battery Manufacturers in 2023
This was originally posted on our Voronoi app. Download the app for free on iOS or Android and discover incredible data-driven charts from a variety of trusted sources.
Despite efforts from the U.S. and EU to secure local domestic supply, all major EV battery manufacturers remain based in Asia.
In this graphic we rank the top 10 EV battery manufacturers by total battery deployment (measured in megawatt-hours) in 2023. The data is from EV Volumes.
Chinese Dominance
Contemporary Amperex Technology Co. Limited (CATL) has swiftly risen in less than a decade to claim the title of the largest global battery group.
The Chinese company now has a 34% share of the market and supplies batteries to a range of made-in-China vehicles, including the Tesla Model Y, SAIC’s MG4/Mulan, and Li Auto models.
| Company | Country | 2023 Production (megawatt-hour) | Share of Total Production |
|---|---|---|---|
| CATL | 🇨🇳China | 242,700 | 34% |
| BYD | 🇨🇳China | 115,917 | 16% |
| LG Energy Solution | 🇰🇷Korea | 108,487 | 15% |
| Panasonic | 🇯🇵Japan | 56,560 | 8% |
| SK On | 🇰🇷Korea | 40,711 | 6% |
| Samsung SDI | 🇰🇷Korea | 35,703 | 5% |
| CALB | 🇨🇳China | 23,493 | 3% |
| Farasis Energy | 🇨🇳China | 16,527 | 2% |
| Envision AESC | 🇨🇳China | 8,342 | 1% |
| Sunwoda | 🇨🇳China | 6,979 | 1% |
| Other | - | 56,040 | 8% |
In 2023, BYD surpassed LG Energy Solution to claim second place. This was driven by demand from its own models and growth in third-party deals, including providing batteries for the made-in-Germany Tesla Model Y, Toyota bZ3, Changan UNI-V, Venucia V-Online, as well as several Haval and FAW models.
The top three battery makers (CATL, BYD, LG) collectively account for two-thirds (66%) of total battery deployment.
Once a leader in the EV battery business, Panasonic now holds the fourth position with an 8% market share, down from 9% last year. With its main client, Tesla, now effectively sourcing batteries from multiple suppliers, the Japanese battery maker seems to be losing its competitive edge in the industry.
Overall, the global EV battery market size is projected to grow from $49 billion in 2022 to $98 billion by 2029, according to Fortune Business Insights.
Electrification
White Gold: Mapping U.S. Lithium Mines
In this graphic, Visual Capitalist partnerered with EnergyX to explore the size and location of U.S. lithium mines.

White Gold: Mapping U.S. Lithium Mines
The U.S. doubled imports of lithium-ion batteries for the third consecutive year in 2022, and with EV demand growing yearly, U.S. lithium mines must ramp up production or rely on other nations for their supply of refined lithium.
To determine if the domestic U.S. lithium opportunity can meet demand, we partnered with EnergyX to determine how much lithium sits within U.S. borders.
U.S. Lithium Projects
The most crucial measure of a lithium mine’s potential is the quantity that can be extracted from the source.
For each lithium resource, the potential volume of lithium carbonate equivalent (LCE) was calculated with a ratio of one metric ton of lithium producing 5.32 metric tons of LCE. Cumulatively, existing U.S. lithium projects contain 94.8 million metric tons of LCE.
| Rank | Project Name | LCE, million metric tons (est.) |
|---|---|---|
| 1 | McDermitt Caldera | 21.5 |
| 2 | Thacker Pass | 19.1 |
| 3 | Tonopah Flats | 18.0 |
| 4 | TLC Lithium | 10.7 |
| 5 | Clayton Valley (Century Lithium) | 6.3 |
| 6 | Zeus Lithium | 6.3 |
| 7 | Rhyolite Ridge | 3.4 |
| 8 | Arkansas Smackover (Phase 1A) | 2.8 |
| 9 | Basin Project | 2.2 |
| 10 | McGee Deposit | 2.1 |
| 11 | Arkansas Smackover (South West) | 1.8 |
| 12 | Clayton Valley (Lithium-X, Pure Energy) | 0.8 |
| 13 | Big Sandy | 0.3 |
| 14 | Imperial Valley/Salton Sea | 0.3 |
U.S. Lithium Opportunities, By State
U.S. lithium projects mainly exist in western states, with comparatively minor opportunities in central or eastern states.
| State | LCE, million metric tons (est.) |
|---|---|
| Nevada | 88.2 |
| Arkansas | 4.6 |
| Arizona | 2.5 |
| California | 0.3 |
Currently, the U.S. is sitting on a wealth of lithium that it is underutilizing. For context, in 2022, the U.S. only produced about 5,000 metric tons of LCE and imported a projected 19,000 metric tons of LCE, showing that the demand for the mineral is healthy.
The Next Gold Rush?
U.S. lithium companies have the opportunity to become global leaders in lithium production and accelerate the transition to sustainable energy sources. This is particularly important as the demand for lithium is increasing every year.
EnergyX is on a mission to meet U.S. lithium demands using groundbreaking technology that can extract 300% more lithium from a source than traditional methods.
You can take advantage of this opportunity by investing in EnergyX and joining other significant players like GM in becoming a shareholder.


-

 Electrification3 years ago
Ranked: The Top 10 EV Battery Manufacturers
-

 Electrification2 years ago
The Key Minerals in an EV Battery
-

 Real Assets3 years ago
The World’s Top 10 Gold Mining Companies
-

 Misc3 years ago
All the Metals We Mined in One Visualization
-

 Electrification3 years ago
The Biggest Mining Companies in the World in 2021
-

 Energy Shift2 years ago
What Are the Five Major Types of Renewable Energy?
-

 Electrification2 years ago
The World’s Largest Nickel Mining Companies
-

 Electrification2 years ago
Mapped: Solar Power by Country in 2021