

Energy Shift
Ranked: The Most Carbon-Intensive Sectors in the World
Ranked: The Most Carbon-Intensive Sectors in the World
Ever wonder which sectors contribute the most to CO2 emissions around the world?
In this graphic, we explore the answers to that question by comparing average Scope 1 emission intensities by sector, according to an analysis done by S&P Global Inc.
Defining Scope 1 Emissions
Before diving into the data, it may be useful to understand what Scope 1 emissions entail.
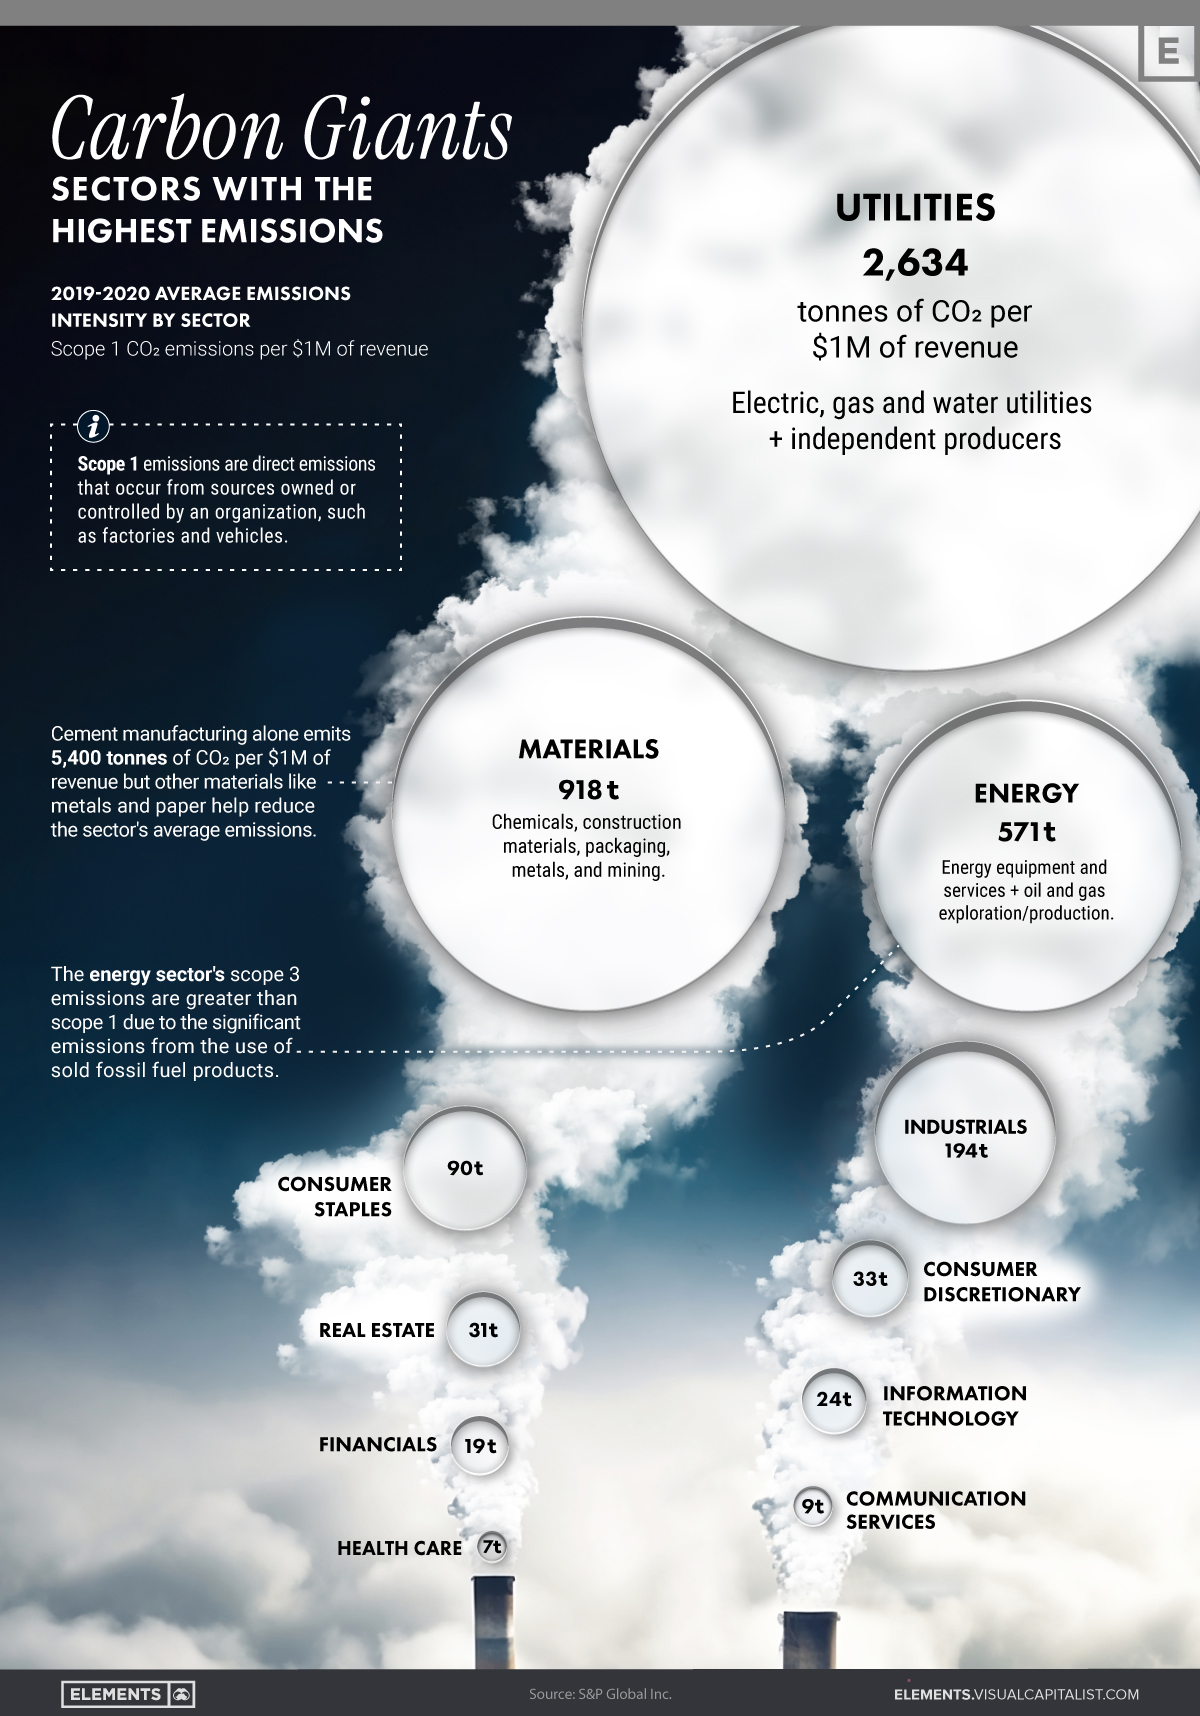
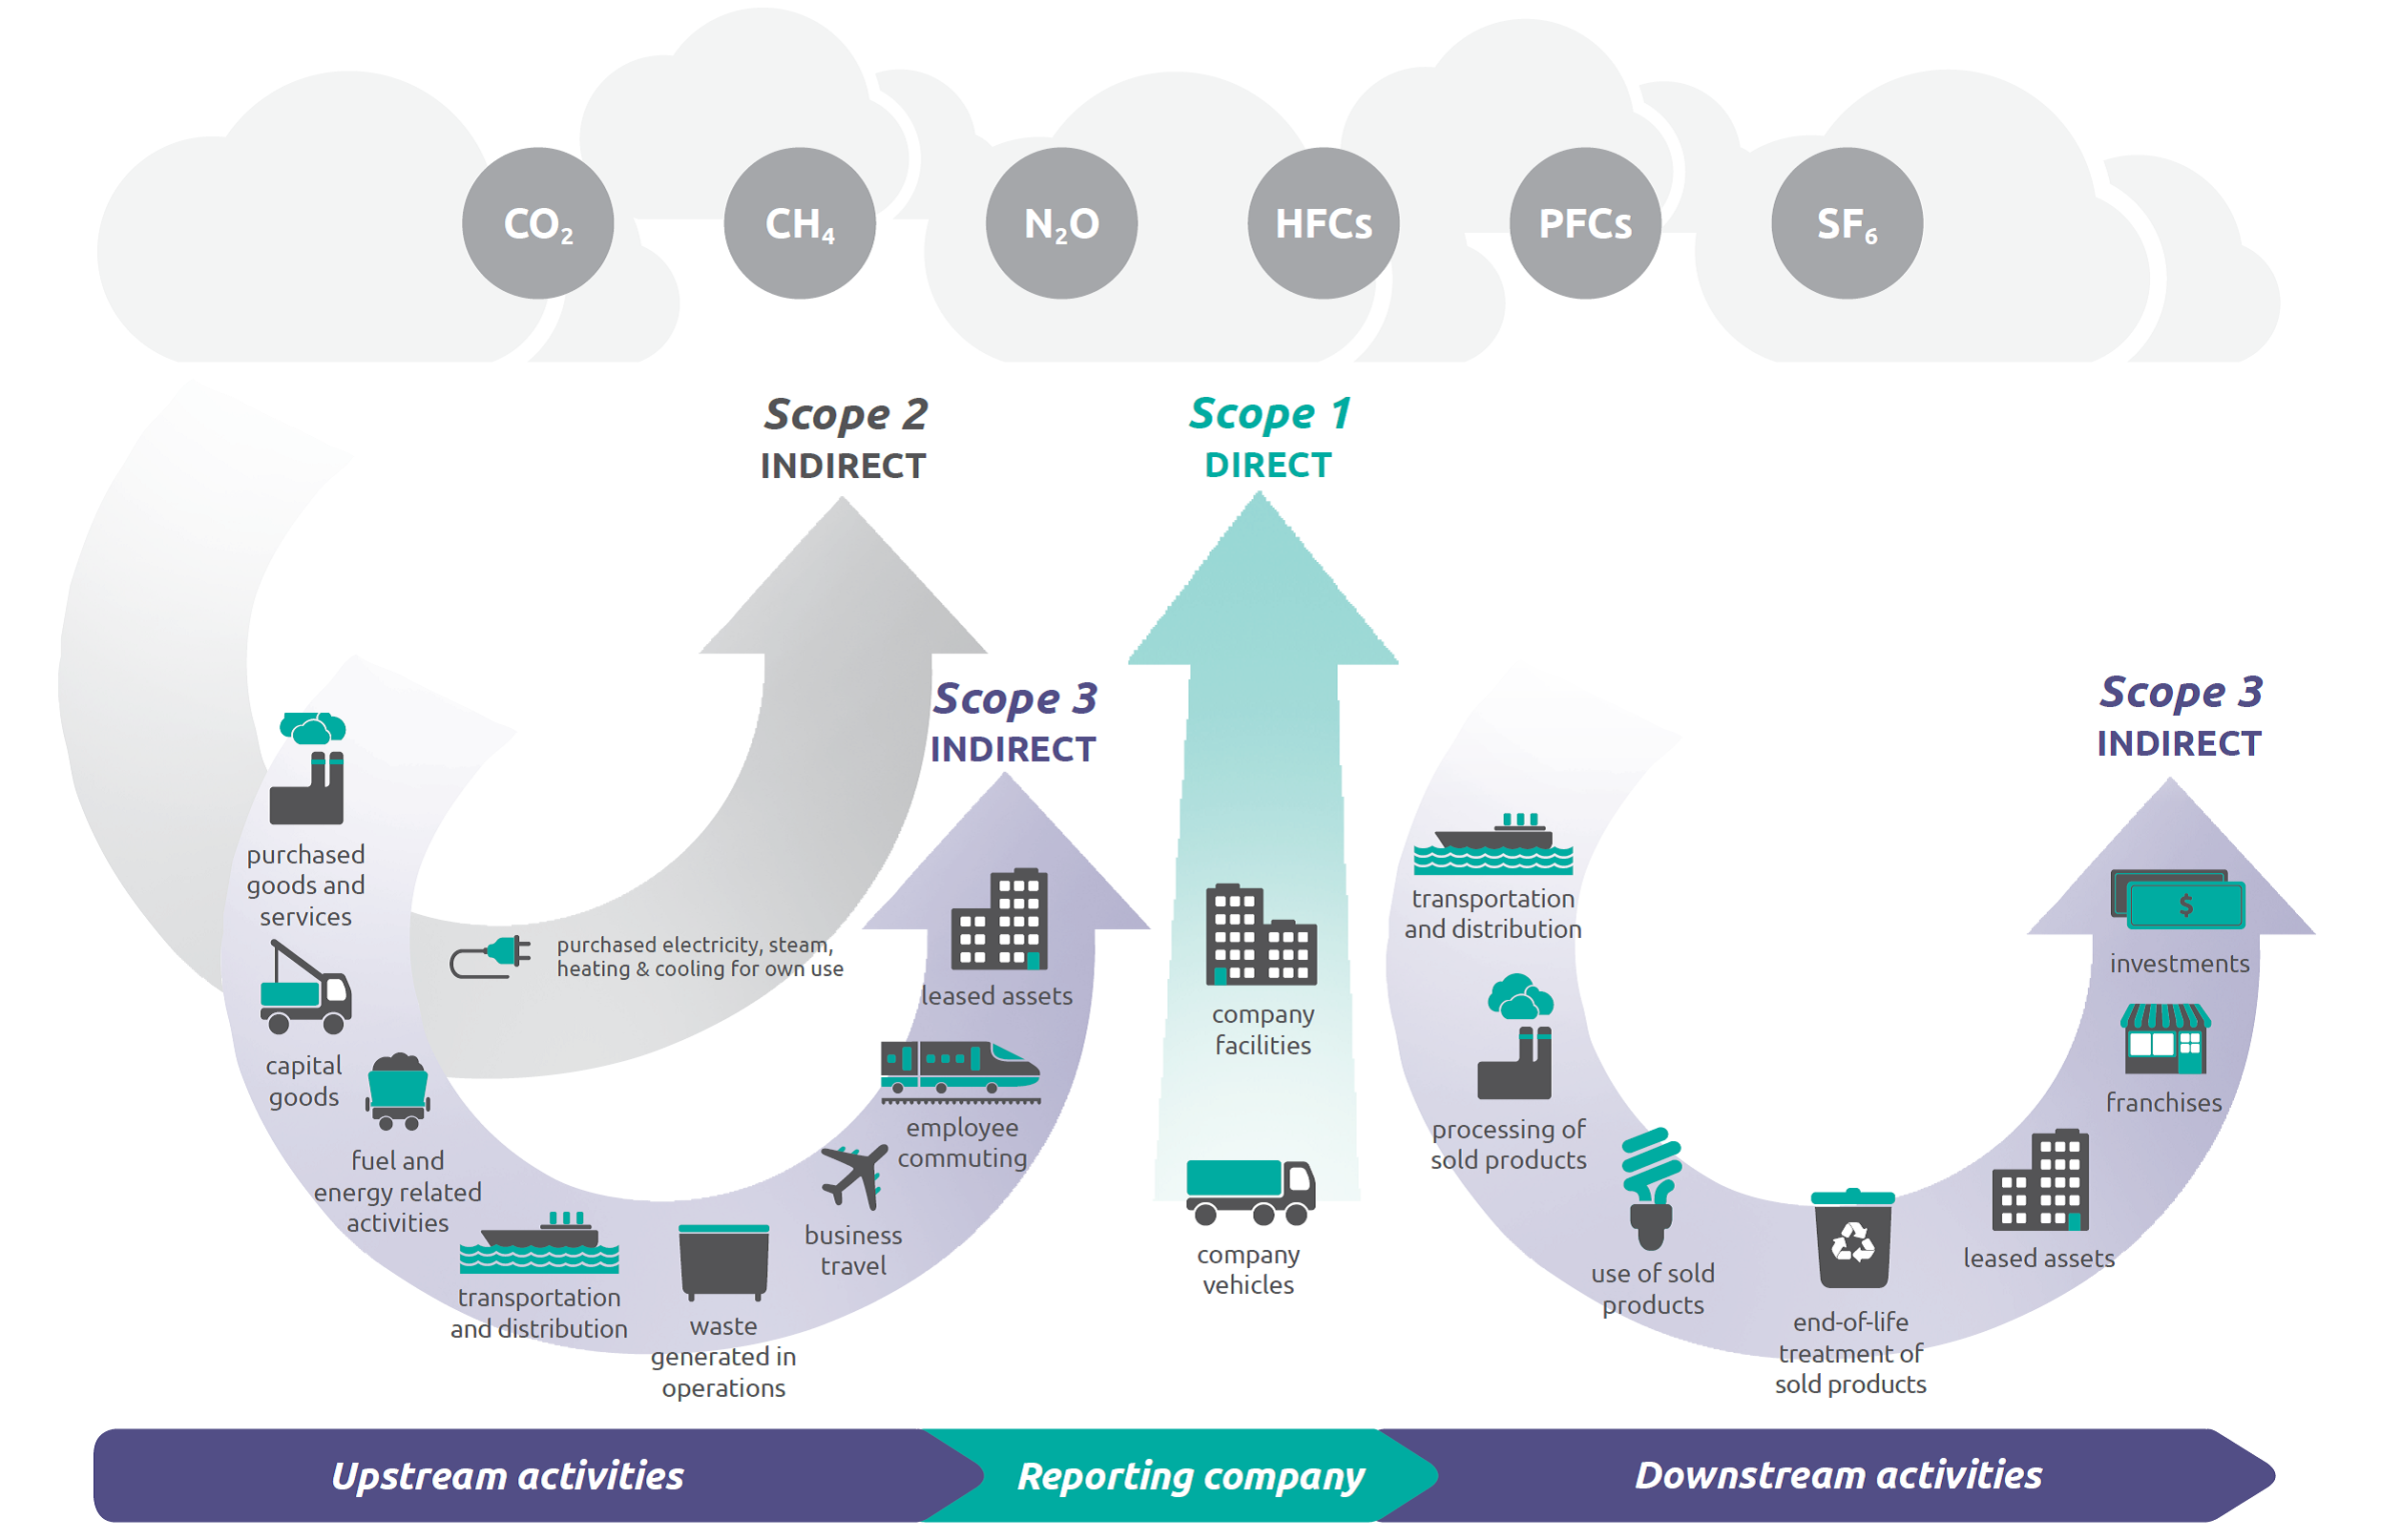
Scope 1 emissions are direct greenhouse gas emissions from sources that are owned or controlled by a company, such as their facilities and vehicles.
Source: U.S. Environmental Protection Agency
Scope 1 emissions can do a good job of highlighting a company’s environmental footprint because they represent the direct emissions related to manufacturing or creating a company’s products, whether they are tangible goods, digital software, or services.
Scope 2 and 3 emissions, on the other hand, encompass the indirect emissions associated with a company’s activities, including those from a company’s purchased electricity, leased assets, or investments.
Ranking the Carbon Giants
According to S&P Global’s analysis of 2019-2020 average emissions intensity by sector, utilities is the most carbon-intensive sector in the world, emitting a staggering 2,634 tonnes of CO2 per $1 million of revenue.
Materials and energy sectors follow behind, with 918 tonnes and 571 tonnes of CO2 emitted, respectively.
| Sector | Sector Explanation | Scope 1 CO2 emissions per $1M of revenue, 2019-2020 |
|---|---|---|
| Utilities | Electric, gas, and water utilities and independent producers | 2,634 tonnes |
| Materials | Chemicals, construction materials, packaging, metals, and mining | 918 tonnes |
| Energy | Oil and gas exploration/production and energy equipment | 571 tonnes |
| Industrials | Capital goods, commercial services, and transportation | 194 tonnes |
| Consumer staples | Food, household goods, and personal products | 90 tonnes |
| Consumer discretionary | Automobiles, consumer durables, apparel, and retailing | 33 tonnes |
| Real estate | Real estate and real estate management | 31 tonnes |
| Information technology | Software, technology hardware, and semiconductors | 24 tonnes |
| Financials | Banks, insurance, and diversified financials | 19 tonnes |
| Communication services | Telecommunication, media, and entertainment | 9 tonnes |
| Health care | Health care equipment, pharmaceuticals, biotechnology, and life sciences | 7 tonnes |
S&P Global also reveals some interesting insights when it comes to various industries within the materials sector, including:
- Cement manufacturing exhibits an extremely high level of Scope 1 emissions, emitting more than double the emissions from the utilities sector (5,415 tonnes of CO2 per $1M of revenue)
- Aluminum and steel production are also quite emission-intensive, emitting 1,421 and 1,390 tonnes respectively in 2019-2020
- Relatively lower-emission materials such as gold, glass, metals and paper products bring down the average emissions of the materials sector
Given these trends, a closer look at emission-intensive industries and sectors is necessary for our urgent need to decarbonize the global economy.


Energy Shift
Who’s Building the Most Solar Energy?
China’s solar capacity triples USA, nearly doubles EU.

Who’s Building the Most Solar Energy?
This was originally posted on our Voronoi app. Download the app for free on iOS or Android and discover incredible data-driven charts from a variety of trusted sources.
In 2023, solar energy accounted for three-quarters of renewable capacity additions worldwide. Most of this growth occurred in Asia, the EU, and the U.S., continuing a trend observed over the past decade.
In this graphic, we illustrate the rise in installed solar photovoltaic (PV) capacity in China, the EU, and the U.S. between 2010 and 2022, measured in gigawatts (GW). Bruegel compiled the data..
Chinese Dominance
As of 2022, China’s total installed capacity stands at 393 GW, nearly double that of the EU’s 205 GW and surpassing the USA’s total of 113 GW by more than threefold in absolute terms.
| Installed solar capacity (GW) | China | EU27 | U.S. |
|---|---|---|---|
| 2022 | 393.0 | 205.5 | 113.0 |
| 2021 | 307.0 | 162.7 | 95.4 |
| 2020 | 254.0 | 136.9 | 76.4 |
| 2019 | 205.0 | 120.1 | 61.6 |
| 2018 | 175.3 | 104.0 | 52.0 |
| 2017 | 130.8 | 96.2 | 43.8 |
| 2016 | 77.8 | 91.5 | 35.4 |
| 2015 | 43.6 | 87.7 | 24.2 |
| 2014 | 28.4 | 83.6 | 18.1 |
| 2013 | 17.8 | 79.7 | 13.3 |
| 2012 | 6.7 | 71.1 | 8.6 |
| 2011 | 3.1 | 53.3 | 5.6 |
| 2010 | 1.0 | 30.6 | 3.4 |
Since 2017, China has shown a compound annual growth rate (CAGR) of approximately 25% in installed PV capacity, while the USA has seen a CAGR of 21%, and the EU of 16%.
Additionally, China dominates the production of solar power components, currently controlling around 80% of the world’s solar panel supply chain.
In 2022, China’s solar industry employed 2.76 million individuals, with manufacturing roles representing approximately 1.8 million and the remaining 918,000 jobs in construction, installation, and operations and maintenance.
The EU industry employed 648,000 individuals, while the U.S. reached 264,000 jobs.
According to the IEA, China accounts for almost 60% of new renewable capacity expected to become operational globally by 2028.
Despite the phasing out of national subsidies in 2020 and 2021, deployment of solar PV in China is accelerating. The country is expected to reach its national 2030 target for wind and solar PV installations in 2024, six years ahead of schedule.
Energy Shift
The World’s Biggest Oil Producers in 2023
Just three countries accounted for 40% of global oil production last year.

The World’s Biggest Oil Producers in 2023
This was originally posted on our Voronoi app. Download the app for free on iOS or Android and discover incredible data-driven charts from a variety of trusted sources.
Despite efforts to decarbonize the global economy, oil still remains one of the world’s most important resources. It’s also produced by a fairly limited group of countries, which can be a source of economic and political leverage.
This graphic illustrates global crude oil production in 2023, measured in million barrels per day, sourced from the U.S. Energy Information Administration (EIA).
Three Countries Account for 40% of Global Oil Production
In 2023, the United States, Russia, and Saudi Arabia collectively contributed 32.7 million barrels per day to global oil production.
| Oil Production 2023 | Million barrels per day |
|---|---|
| 🇺🇸 U.S. | 12.9 |
| 🇷🇺 Russia | 10.1 |
| 🇸🇦 Saudi Arabia | 9.7 |
| 🇨🇦 Canada | 4.6 |
| 🇮🇶 Iraq | 4.3 |
| 🇨🇳 China | 4.2 |
| 🇮🇷 Iran | 3.6 |
| 🇧🇷 Brazil | 3.4 |
| 🇦🇪 UAE | 3.4 |
| 🇰🇼 Kuwait | 2.7 |
| 🌍 Other | 22.8 |
These three nations have consistently dominated oil production since 1971. The leading position, however, has alternated among them over the past five decades.
In contrast, the combined production of the next three largest producers—Canada, Iraq, and China—reached 13.1 million barrels per day in 2023, just surpassing the production of the United States alone.
In the near term, no country is likely to surpass the record production achieved by the U.S. in 2023, as no other producer has ever reached a daily capacity of 13.0 million barrels. Recently, Saudi Arabia’s state-owned Saudi Aramco scrapped plans to increase production capacity to 13.0 million barrels per day by 2027.
In 2024, analysts forecast that the U.S. will maintain its position as the top oil producer. In fact, according to Macquarie Group, U.S. oil production is expected to achieve a record pace of about 14 million barrels per day by the end of the year.

-

 Electrification3 years ago
Ranked: The Top 10 EV Battery Manufacturers
-

 Electrification2 years ago
The Key Minerals in an EV Battery
-

 Real Assets3 years ago
The World’s Top 10 Gold Mining Companies
-

 Misc3 years ago
All the Metals We Mined in One Visualization
-

 Energy Shift2 years ago
What Are the Five Major Types of Renewable Energy?
-

 Electrification2 years ago
Mapped: Solar Power by Country in 2021
-

 Electrification2 years ago
The World’s Largest Nickel Mining Companies
-

 Misc3 years ago
The Largest Copper Mines in the World by Capacity