

Electrification
Charted: The Most Expensive Battery Metals
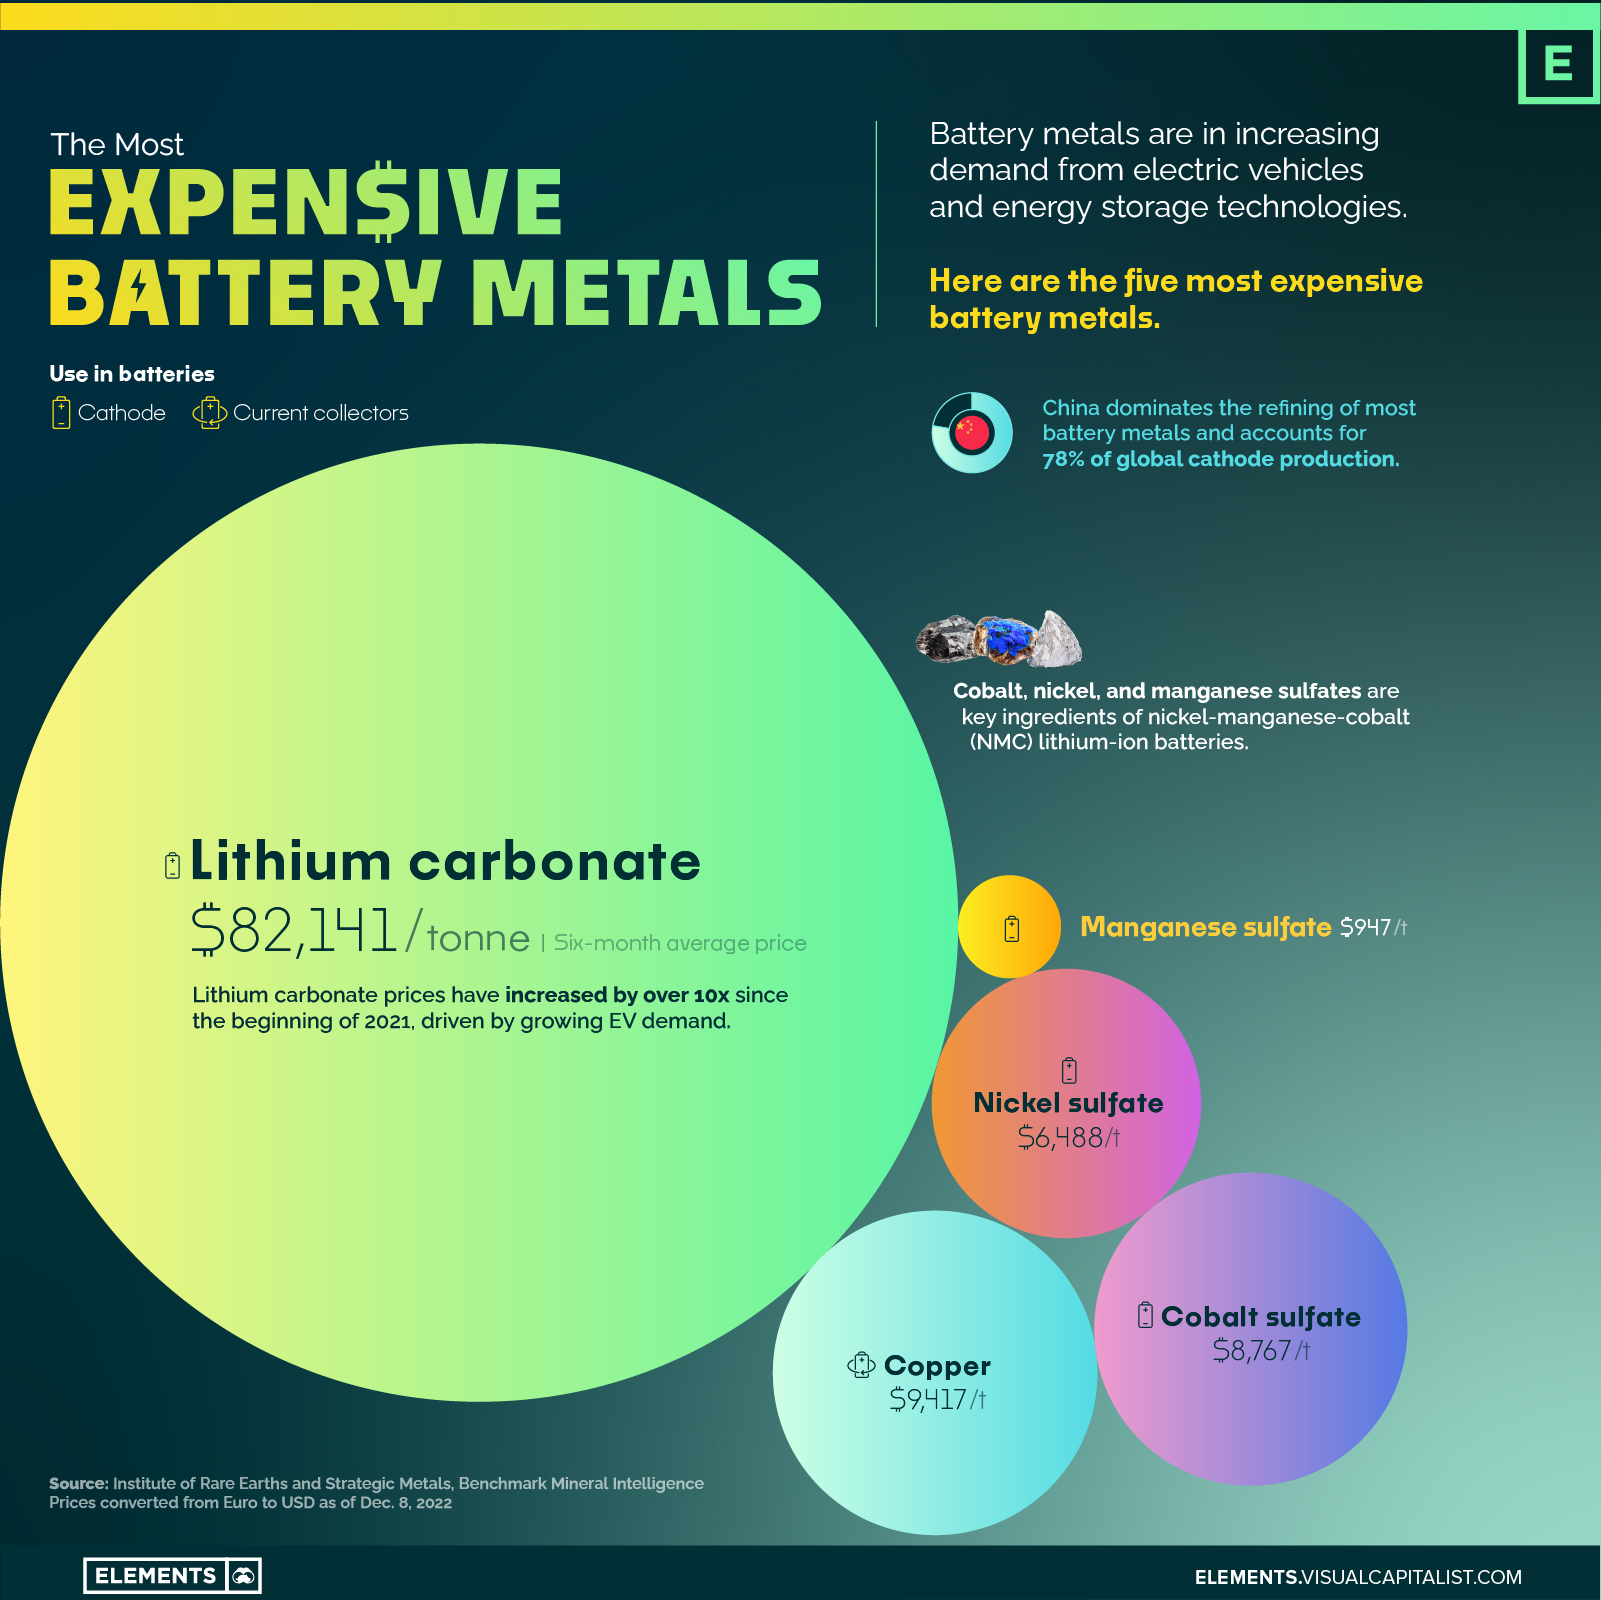
The Five Most Expensive Battery Metals
Battery metal markets are booming on the back of rising electric vehicle sales.
Supply chain issues and a global rush to secure supplies have skyrocketed battery metal prices over the last year. And if battery metals remain expensive, the decade-long freefall in lithium-ion battery prices might come to a temporary halt.
The above infographic highlights the five most expensive battery metals as of December 2022 using prices from the Institute of Rare Earths and Strategic Metals (ISE).
How Much Do Battery Metals Cost?
Cobalt was by far the most expensive battery metal until late 2021, which was when lithium prices hit an inflection point, heading towards all-time highs.
A single tonne of lithium carbonate, one of the refined forms of lithium that’s used in batteries, now costs over $80,000, up from around $6,500 at the beginning of 2021.
| Metal | Price per tonne (6-month average) | Use in batteries |
|---|---|---|
| Lithium carbonate | $82,141 | Cathode |
| Copper | $9,417 | Current collectors |
| Cobalt sulfate | $8,767 | Cathode |
| Nickel sulfate | $6,488 | Cathode |
| Manganese sulfate | $947 | Cathode |
Prices have been converted from Euro to USD as of Dec. 8, 2022.
Lithium carbonate prices rose by around 496% in 2021, and have surged by over 100% year-to-date as of November 2022. Increasing EV demand and sales are driving prices from the demand side, with the lack of supply tightening the squeeze.
This year, lithium supplies have been affected by heatwaves in China, where some factories were temporarily shut down due to power shortages from drought-hit hydropower generation. From a broader perspective, it takes anywhere between three to five years for new lithium supply capacity to come online, making it difficult for suppliers to react quickly to rising demand.
Cobalt’s high cost is largely attributed to how geographically concentrated its supply is. Around 70% of global mined cobalt production comes from the Democratic Republic of Congo (DRC). Furthermore, cobalt mining in the DRC is associated with several human rights issues, including child labor.
The majority of the most expensive battery metals are used to build the cathode. The cathode is arguably the most important part of the battery, determining performance, longevity, and range. Copper is the only non-cathode material on the list. Thanks to its excellent electrical conductivity, copper is used as a current collector for battery anodes, serving as a medium for electric current and an outlet for heat.
On average, the cathode accounts for 51% of the cost of a single lithium-ion battery cell, largely due to the metals it contains.
What Does This Mean for EVs?
After falling by 89% from 2010 to 2021, lithium-ion battery pack prices are forecasted to rise this year, according to BloombergNEF.
Average battery pack prices are expected to increase from $132 per kilowatt-hour (kWh) in 2021 to $135/kWh in 2022. While the increase is small, if prolonged, it could delay price parity between EVs and gas-powered cars, which is projected to occur once prices fall below $100/kWh.
In terms of the EV transition, higher battery metal prices could ultimately end up increasing the cost of the average electric vehicle, potentially becoming a speed bump to EV adoption. Consequently, an increase in battery metal supply and the subsequent stabilization in prices will be critical in keeping EV momentum on track.


Electrification
Ranked: The Top 10 EV Battery Manufacturers in 2023
Asia dominates this ranking of the world’s largest EV battery manufacturers in 2023.

The Top 10 EV Battery Manufacturers in 2023
This was originally posted on our Voronoi app. Download the app for free on iOS or Android and discover incredible data-driven charts from a variety of trusted sources.
Despite efforts from the U.S. and EU to secure local domestic supply, all major EV battery manufacturers remain based in Asia.
In this graphic we rank the top 10 EV battery manufacturers by total battery deployment (measured in megawatt-hours) in 2023. The data is from EV Volumes.
Chinese Dominance
Contemporary Amperex Technology Co. Limited (CATL) has swiftly risen in less than a decade to claim the title of the largest global battery group.
The Chinese company now has a 34% share of the market and supplies batteries to a range of made-in-China vehicles, including the Tesla Model Y, SAIC’s MG4/Mulan, and Li Auto models.
| Company | Country | 2023 Production (megawatt-hour) | Share of Total Production |
|---|---|---|---|
| CATL | 🇨🇳China | 242,700 | 34% |
| BYD | 🇨🇳China | 115,917 | 16% |
| LG Energy Solution | 🇰🇷Korea | 108,487 | 15% |
| Panasonic | 🇯🇵Japan | 56,560 | 8% |
| SK On | 🇰🇷Korea | 40,711 | 6% |
| Samsung SDI | 🇰🇷Korea | 35,703 | 5% |
| CALB | 🇨🇳China | 23,493 | 3% |
| Farasis Energy | 🇨🇳China | 16,527 | 2% |
| Envision AESC | 🇨🇳China | 8,342 | 1% |
| Sunwoda | 🇨🇳China | 6,979 | 1% |
| Other | - | 56,040 | 8% |
In 2023, BYD surpassed LG Energy Solution to claim second place. This was driven by demand from its own models and growth in third-party deals, including providing batteries for the made-in-Germany Tesla Model Y, Toyota bZ3, Changan UNI-V, Venucia V-Online, as well as several Haval and FAW models.
The top three battery makers (CATL, BYD, LG) collectively account for two-thirds (66%) of total battery deployment.
Once a leader in the EV battery business, Panasonic now holds the fourth position with an 8% market share, down from 9% last year. With its main client, Tesla, now effectively sourcing batteries from multiple suppliers, the Japanese battery maker seems to be losing its competitive edge in the industry.
Overall, the global EV battery market size is projected to grow from $49 billion in 2022 to $98 billion by 2029, according to Fortune Business Insights.
Electrification
White Gold: Mapping U.S. Lithium Mines
In this graphic, Visual Capitalist partnerered with EnergyX to explore the size and location of U.S. lithium mines.

White Gold: Mapping U.S. Lithium Mines
The U.S. doubled imports of lithium-ion batteries for the third consecutive year in 2022, and with EV demand growing yearly, U.S. lithium mines must ramp up production or rely on other nations for their supply of refined lithium.
To determine if the domestic U.S. lithium opportunity can meet demand, we partnered with EnergyX to determine how much lithium sits within U.S. borders.
U.S. Lithium Projects
The most crucial measure of a lithium mine’s potential is the quantity that can be extracted from the source.
For each lithium resource, the potential volume of lithium carbonate equivalent (LCE) was calculated with a ratio of one metric ton of lithium producing 5.32 metric tons of LCE. Cumulatively, existing U.S. lithium projects contain 94.8 million metric tons of LCE.
| Rank | Project Name | LCE, million metric tons (est.) |
|---|---|---|
| 1 | McDermitt Caldera | 21.5 |
| 2 | Thacker Pass | 19.1 |
| 3 | Tonopah Flats | 18.0 |
| 4 | TLC Lithium | 10.7 |
| 5 | Clayton Valley (Century Lithium) | 6.3 |
| 6 | Zeus Lithium | 6.3 |
| 7 | Rhyolite Ridge | 3.4 |
| 8 | Arkansas Smackover (Phase 1A) | 2.8 |
| 9 | Basin Project | 2.2 |
| 10 | McGee Deposit | 2.1 |
| 11 | Arkansas Smackover (South West) | 1.8 |
| 12 | Clayton Valley (Lithium-X, Pure Energy) | 0.8 |
| 13 | Big Sandy | 0.3 |
| 14 | Imperial Valley/Salton Sea | 0.3 |
U.S. Lithium Opportunities, By State
U.S. lithium projects mainly exist in western states, with comparatively minor opportunities in central or eastern states.
| State | LCE, million metric tons (est.) |
|---|---|
| Nevada | 88.2 |
| Arkansas | 4.6 |
| Arizona | 2.5 |
| California | 0.3 |
Currently, the U.S. is sitting on a wealth of lithium that it is underutilizing. For context, in 2022, the U.S. only produced about 5,000 metric tons of LCE and imported a projected 19,000 metric tons of LCE, showing that the demand for the mineral is healthy.
The Next Gold Rush?
U.S. lithium companies have the opportunity to become global leaders in lithium production and accelerate the transition to sustainable energy sources. This is particularly important as the demand for lithium is increasing every year.
EnergyX is on a mission to meet U.S. lithium demands using groundbreaking technology that can extract 300% more lithium from a source than traditional methods.
You can take advantage of this opportunity by investing in EnergyX and joining other significant players like GM in becoming a shareholder.


-

 Electrification3 years ago
Ranked: The Top 10 EV Battery Manufacturers
-

 Electrification2 years ago
The Key Minerals in an EV Battery
-

 Real Assets3 years ago
The World’s Top 10 Gold Mining Companies
-

 Misc3 years ago
All the Metals We Mined in One Visualization
-

 Electrification3 years ago
The Biggest Mining Companies in the World in 2021
-

 Energy Shift2 years ago
What Are the Five Major Types of Renewable Energy?
-

 Electrification2 years ago
Mapped: Solar Power by Country in 2021
-

 Electrification2 years ago
The World’s Largest Nickel Mining Companies