

Electrification
Lithium Prices Surge on EV Demand from China
Lithium Prices Surge on EV Demand from China
Amid growing conviction on the bright future of electric vehicles (EVs), the scramble for battery metals like lithium is just beginning.
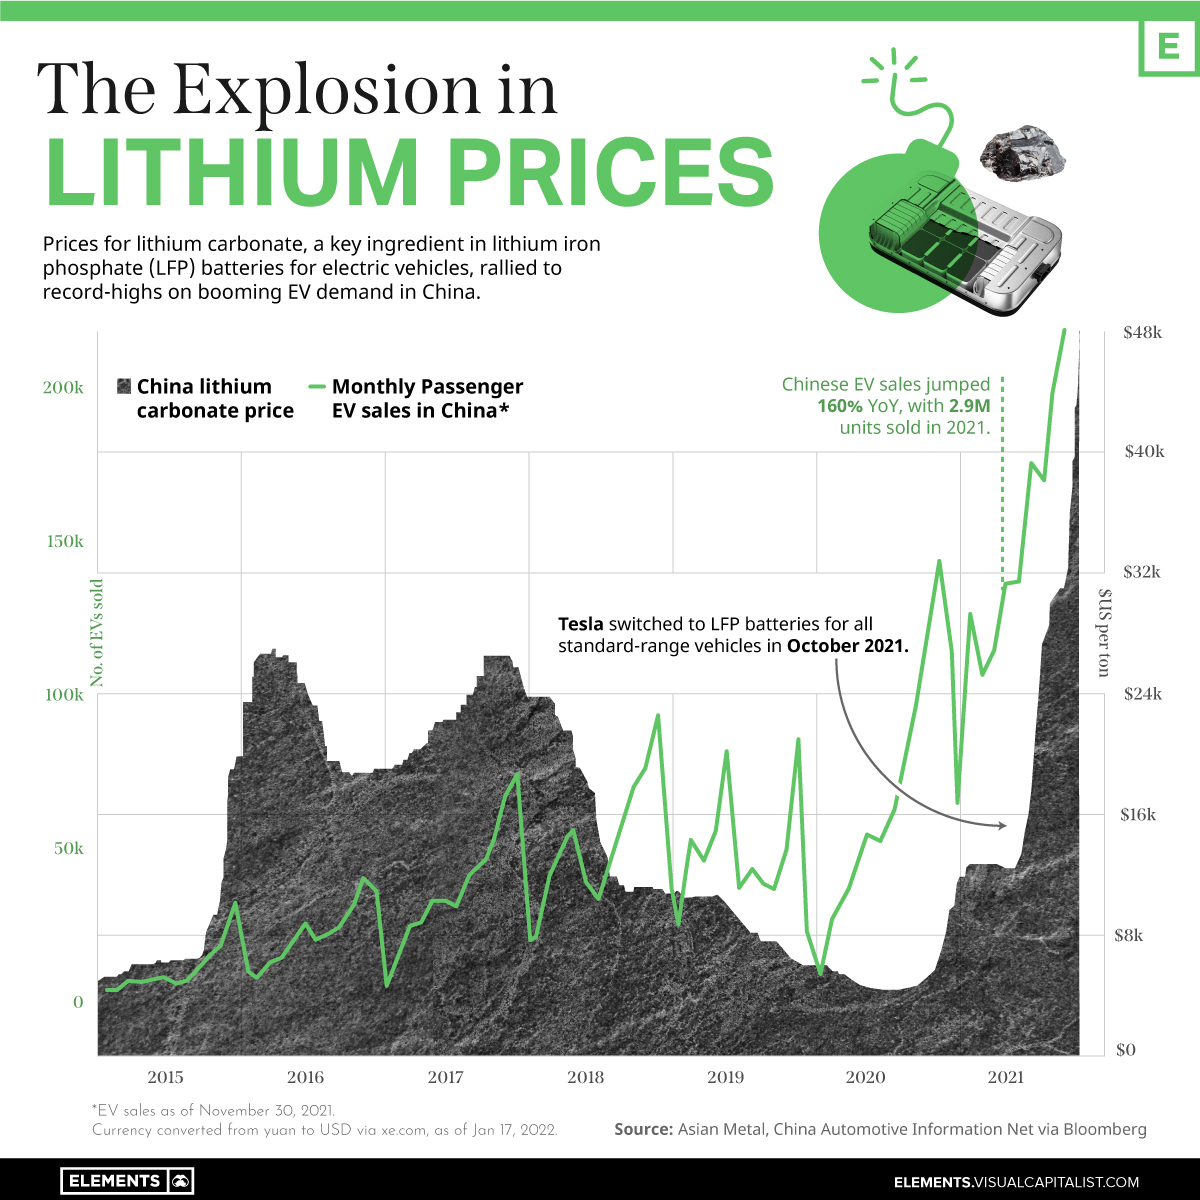
By the first week of 2022, prices for lithium carbonate, a key ingredient in lithium iron phosphate (LFP) batteries, reached a new high of 300,000 yuan or nearly $47,500 per ton in China.
The above graphic charts the exponential surge in both lithium prices and China’s EV sales between 2015 and 2021.
How Lithium Prices Changed in 2021
After brief spikes in 2016 and 2017, lithium prices were on a downtrend until 2021. With that context, it’s safe to say that the year’s 497% surge was nothing short of dramatic.
Here’s how lithium prices changed in 2021, on a quarterly basis:
| Date | Lithium carbonate price per ton in China* | % increase in 2021 |
|---|---|---|
| January 01, 2021 | $7,328.90 | 0% |
| April 01, 2021 | $13,396.90 | 82.70% |
| July 01, 2021 | $14,024.40 | 91.40% |
| October 01, 2021 | $27,733.70 | 278.50% |
| December 31, 2021 | $43,732.80 | 496.70% |
*Represents prices for battery-grade lithium carbonate. Converted from yuan to USD via xe.com as of Jan 19, 2022.
Source: TradingEconomics
As producers struggled to keep up with rising demand for battery-grade lithium carbonate, prices increased six-fold in 2021.
This rise was amplified in October when Tesla announced a switch to LFP batteries for all of its standard-range cars. Previously, Tesla only used LFP batteries for cars produced in China.
EV Batteries and the Resurgence of LFP Cathodes
Why did Tesla make the switch?
LFP was the initial cathode chemistry used in lithium-ion batteries for EVs in China, the largest market for EVs. Over time, consumer preferences for longer driving ranges drove manufacturers towards higher-density lithium nickel manganese cobalt (NMC) cathodes, which can manage longer distances on a single charge.
However, most of the cobalt used in NMC batteries comes from the Democratic Republic of the Congo, where cobalt mining is associated with several humanitarian issues. These concerns, along with the high material cost of cobalt, prompted automakers to look at alternative cathode chemistries.
This has caused automakers like Tesla to turn back to LFP cathodes, which do not require cobalt and are relatively cheaper to produce.
Lithium’s Electric Future
According to BloombergNEF, global EV sales were on track to hit 6.3 million units in 2021—nearly double the total of 2020.
However, despite recent growth, EV adoption has a long way to go, with EVs making up just 4.3% of global auto sales in 2020. This suggests that the future is bright for battery metals like lithium, which will likely continue to be in high demand.


Electrification
Ranked: The Top 10 EV Battery Manufacturers in 2023
Asia dominates this ranking of the world’s largest EV battery manufacturers in 2023.

The Top 10 EV Battery Manufacturers in 2023
This was originally posted on our Voronoi app. Download the app for free on iOS or Android and discover incredible data-driven charts from a variety of trusted sources.
Despite efforts from the U.S. and EU to secure local domestic supply, all major EV battery manufacturers remain based in Asia.
In this graphic we rank the top 10 EV battery manufacturers by total battery deployment (measured in megawatt-hours) in 2023. The data is from EV Volumes.
Chinese Dominance
Contemporary Amperex Technology Co. Limited (CATL) has swiftly risen in less than a decade to claim the title of the largest global battery group.
The Chinese company now has a 34% share of the market and supplies batteries to a range of made-in-China vehicles, including the Tesla Model Y, SAIC’s MG4/Mulan, and Li Auto models.
| Company | Country | 2023 Production (megawatt-hour) | Share of Total Production |
|---|---|---|---|
| CATL | 🇨🇳China | 242,700 | 34% |
| BYD | 🇨🇳China | 115,917 | 16% |
| LG Energy Solution | 🇰🇷Korea | 108,487 | 15% |
| Panasonic | 🇯🇵Japan | 56,560 | 8% |
| SK On | 🇰🇷Korea | 40,711 | 6% |
| Samsung SDI | 🇰🇷Korea | 35,703 | 5% |
| CALB | 🇨🇳China | 23,493 | 3% |
| Farasis Energy | 🇨🇳China | 16,527 | 2% |
| Envision AESC | 🇨🇳China | 8,342 | 1% |
| Sunwoda | 🇨🇳China | 6,979 | 1% |
| Other | - | 56,040 | 8% |
In 2023, BYD surpassed LG Energy Solution to claim second place. This was driven by demand from its own models and growth in third-party deals, including providing batteries for the made-in-Germany Tesla Model Y, Toyota bZ3, Changan UNI-V, Venucia V-Online, as well as several Haval and FAW models.
The top three battery makers (CATL, BYD, LG) collectively account for two-thirds (66%) of total battery deployment.
Once a leader in the EV battery business, Panasonic now holds the fourth position with an 8% market share, down from 9% last year. With its main client, Tesla, now effectively sourcing batteries from multiple suppliers, the Japanese battery maker seems to be losing its competitive edge in the industry.
Overall, the global EV battery market size is projected to grow from $49 billion in 2022 to $98 billion by 2029, according to Fortune Business Insights.
Electrification
White Gold: Mapping U.S. Lithium Mines
In this graphic, Visual Capitalist partnerered with EnergyX to explore the size and location of U.S. lithium mines.

White Gold: Mapping U.S. Lithium Mines
The U.S. doubled imports of lithium-ion batteries for the third consecutive year in 2022, and with EV demand growing yearly, U.S. lithium mines must ramp up production or rely on other nations for their supply of refined lithium.
To determine if the domestic U.S. lithium opportunity can meet demand, we partnered with EnergyX to determine how much lithium sits within U.S. borders.
U.S. Lithium Projects
The most crucial measure of a lithium mine’s potential is the quantity that can be extracted from the source.
For each lithium resource, the potential volume of lithium carbonate equivalent (LCE) was calculated with a ratio of one metric ton of lithium producing 5.32 metric tons of LCE. Cumulatively, existing U.S. lithium projects contain 94.8 million metric tons of LCE.
| Rank | Project Name | LCE, million metric tons (est.) |
|---|---|---|
| 1 | McDermitt Caldera | 21.5 |
| 2 | Thacker Pass | 19.1 |
| 3 | Tonopah Flats | 18.0 |
| 4 | TLC Lithium | 10.7 |
| 5 | Clayton Valley (Century Lithium) | 6.3 |
| 6 | Zeus Lithium | 6.3 |
| 7 | Rhyolite Ridge | 3.4 |
| 8 | Arkansas Smackover (Phase 1A) | 2.8 |
| 9 | Basin Project | 2.2 |
| 10 | McGee Deposit | 2.1 |
| 11 | Arkansas Smackover (South West) | 1.8 |
| 12 | Clayton Valley (Lithium-X, Pure Energy) | 0.8 |
| 13 | Big Sandy | 0.3 |
| 14 | Imperial Valley/Salton Sea | 0.3 |
U.S. Lithium Opportunities, By State
U.S. lithium projects mainly exist in western states, with comparatively minor opportunities in central or eastern states.
| State | LCE, million metric tons (est.) |
|---|---|
| Nevada | 88.2 |
| Arkansas | 4.6 |
| Arizona | 2.5 |
| California | 0.3 |
Currently, the U.S. is sitting on a wealth of lithium that it is underutilizing. For context, in 2022, the U.S. only produced about 5,000 metric tons of LCE and imported a projected 19,000 metric tons of LCE, showing that the demand for the mineral is healthy.
The Next Gold Rush?
U.S. lithium companies have the opportunity to become global leaders in lithium production and accelerate the transition to sustainable energy sources. This is particularly important as the demand for lithium is increasing every year.
EnergyX is on a mission to meet U.S. lithium demands using groundbreaking technology that can extract 300% more lithium from a source than traditional methods.
You can take advantage of this opportunity by investing in EnergyX and joining other significant players like GM in becoming a shareholder.


-

 Electrification3 years ago
Ranked: The Top 10 EV Battery Manufacturers
-

 Electrification2 years ago
The Key Minerals in an EV Battery
-

 Real Assets3 years ago
The World’s Top 10 Gold Mining Companies
-

 Misc3 years ago
All the Metals We Mined in One Visualization
-

 Electrification3 years ago
The Biggest Mining Companies in the World in 2021
-

 Energy Shift2 years ago
What Are the Five Major Types of Renewable Energy?
-

 Electrification2 years ago
The World’s Largest Nickel Mining Companies
-

 Electrification2 years ago
Mapped: Solar Power by Country in 2021