

Energy Shift
Ranked: The World’s Biggest Oil Producers
Ranked: The World’s Biggest Oil Producers
This visualization originally appeared on Visual Capitalist
In 2022 oil prices peaked at more than $100 per barrel, hitting an eight-year high, after a full year of turmoil in the energy markets in the wake of the Russian invasion of Ukraine.
Oil companies doubled their profits and the economies of the biggest oil producers in the world got a major boost.
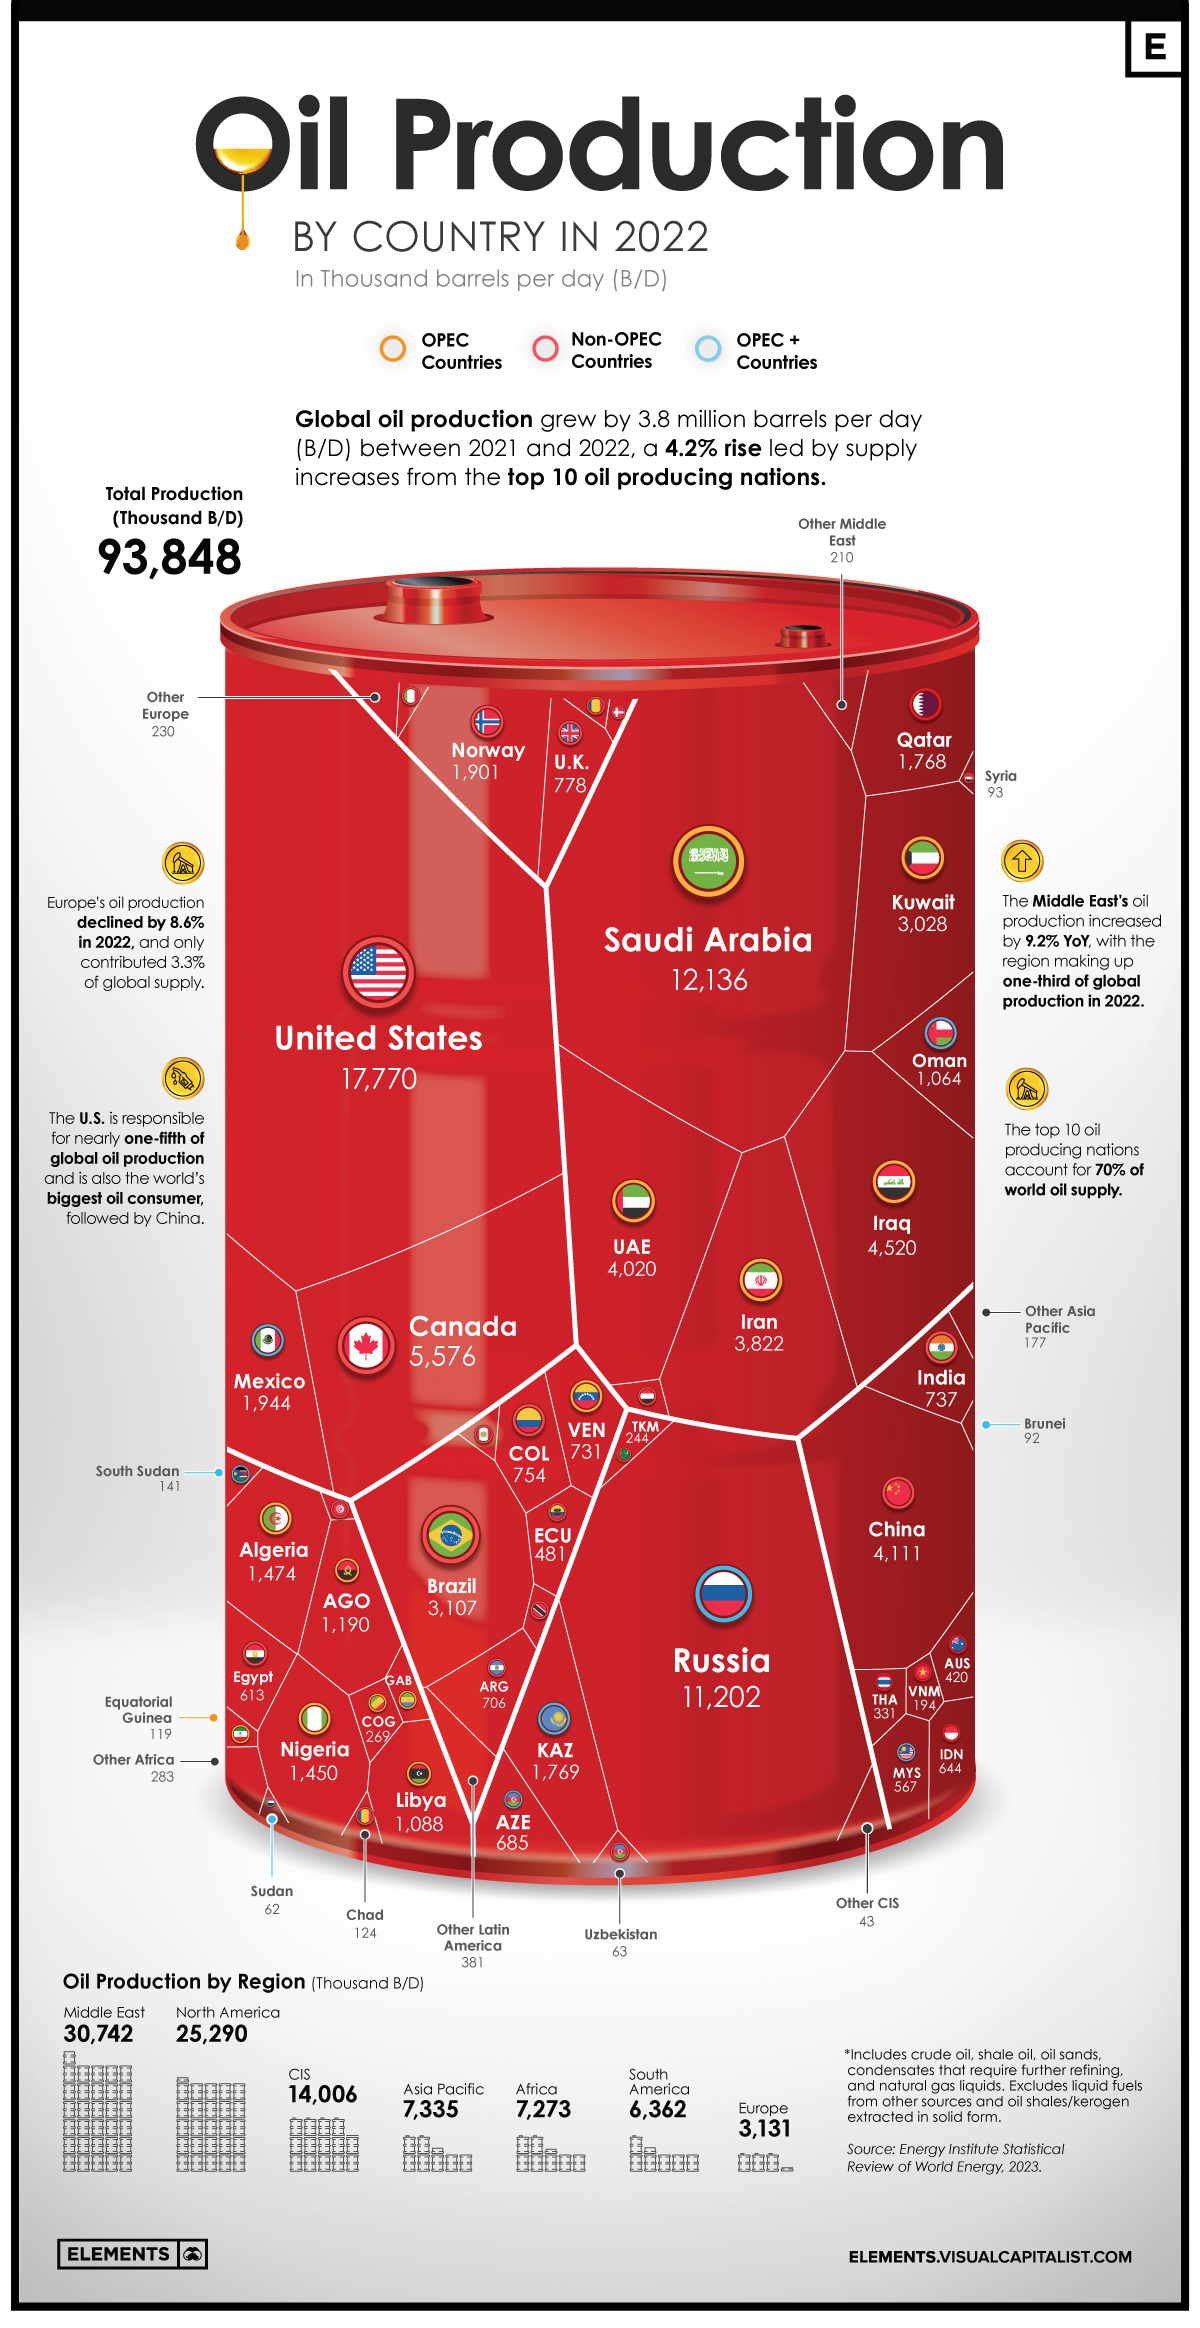
But which countries are responsible for most of the world’s oil supply? Using data from the Statistical Review of World Energy by the Energy Institute, we’ve visualized and ranked the world’s biggest oil producers.
Ranked: Oil Production By Country, in 2022
The U.S. has been the world’s biggest oil producer since 2018 and continued its dominance in 2022 by producing close to 18 million barrels per day (B/D). This accounted for nearly one-fifth of the world’s oil supply.
Almost three-fourths of the country’s oil production is centered around five states: Texas, New Mexico, North Dakota, Alaska, and Colorado.
We rank the other major oil producers in the world below.
| Rank | Country | 2022 Production (Thousand B/D) | YoY Change | Share of World Supply |
|---|---|---|---|---|
| 1 | 🇺🇸 U.S. | 17,770 | +6.5% | 18.9% |
| 2 | 🇸🇦 Saudi Arabia | 12,136 | +10.8% | 12.9% |
| 3 | 🇷🇺 Russia | 11,202 | +1.8% | 11.9% |
| 4 | 🇨🇦 Canada | 5,576 | +3.0% | 5.9% |
| 5 | 🇮🇶 Iraq | 4,520 | +10.2% | 4.8% |
| 6 | 🇨🇳 China | 4,111 | +2.9% | 4.4% |
| 7 | 🇦🇪 UAE | 4,020 | +10.4% | 4.3% |
| 8 | 🇮🇷 Iran | 3,822 | +4.6% | 4.1% |
| 9 | 🇧🇷 Brazil | 3,107 | +3.9% | 3.3% |
| 10 | 🇰🇼 Kuwait | 3,028 | +12.0% | 3.2% |
| 11 | 🇲🇽 Mexico | 1,944 | +0.9% | 2.1% |
| 12 | 🇳🇴 Norway | 1,901 | -6.3% | 2.0% |
| 13 | 🇰🇿 Kazakhstan | 1,769 | -2.0% | 1.9% |
| 14 | 🇶🇦 Qatar | 1,768 | +1.8% | 1.9% |
| 15 | 🇩🇿 Algeria | 1,474 | +8.9% | 1.6% |
| 16 | 🇳🇬 Nigeria | 1,450 | -11.2% | 1.5% |
| 17 | 🇦🇴 Angola | 1,190 | +1.1% | 1.3% |
| 18 | 🇱🇾 Libya | 1,088 | -14.3% | 1.2% |
| 19 | 🇴🇲 Oman | 1,064 | +9.6% | 1.1% |
| 20 | 🇬🇧 UK | 778 | -11.0% | 0.8% |
| 21 | 🇨🇴 Colombia | 754 | +2.4% | 0.8% |
| 22 | 🇮🇳 India | 737 | -3.8% | 0.8% |
| 23 | 🇻🇪 Venezuela | 731 | +8.1% | 0.8% |
| 24 | 🇦🇷 Argentina | 706 | +12.4% | 0.8% |
| 25 | 🇦🇿 Azerbaijan | 685 | -5.6% | 0.7% |
| 26 | 🇮🇩 Indonesia | 644 | -6.9% | 0.7% |
| 27 | 🇪🇬 Egypt | 613 | +0.8% | 0.7% |
| 28 | 🇲🇾 Malaysia | 567 | -1.7% | 0.6% |
| 29 | 🇪🇨 Ecuador | 481 | +1.7% | 0.5% |
| 30 | 🇦🇺 Australia | 420 | -5.2% | 0.4% |
| 31 | 🇹🇭 Thailand | 331 | -17.5% | 0.4% |
| 32 | 🇨🇩 Congo | 269 | -1.7% | 0.3% |
| 33 | 🇹🇲 Turkmenistan | 244 | +1.0% | 0.3% |
| 34 | 🇻🇳 Vietnam | 194 | -1.2% | 0.2% |
| 35 | 🇬🇦 Gabon | 191 | +5.4% | 0.2% |
| 36 | 🇸🇸 South Sudan | 141 | -7.6% | 0.2% |
| 37 | 🇵🇪 Peru | 128 | +0.5% | 0.1% |
| 38 | 🇹🇩 Chad | 124 | +6.2% | 0.1% |
| 39 | 🇬🇶 Equatorial Guinea | 119 | -9.2% | 0.1% |
| 40 | 🇸🇾 Syria | 93 | -2.7% | 0.1% |
| 41 | 🇮🇹 Italy | 92 | -7.9% | 0.1% |
| 42 | 🇧🇳 Brunei | 92 | -13.8% | 0.1% |
| 43 | 🇾🇪 Yemen | 81 | -2.4% | 0.1% |
| 44 | 🇹🇹 Trinidad & Tobago | 74 | -3.6% | 0.1% |
| 45 | 🇷🇴 Romania | 65 | -6.2% | 0.1% |
| 46 | 🇩🇰 Denmark | 65 | -1.6% | 0.1% |
| 47 | 🇺🇿 Uzbekistan | 63 | -0.9% | 0.1% |
| 48 | 🇸🇩 Sudan | 62 | -3.3% | 0.1% |
| 49 | 🇹🇳 Tunisia | 40 | -12.9% | 0.0% |
| 50 | Other CIS | 43 | +4.4% | 0.0% |
| 51 | Other Middle East | 210 | +1.2% | 0.2% |
| 52 | Other Africa | 283 | -3.4% | 0.3% |
| 53 | Other Europe | 230 | -20.5% | 0.2% |
| 54 | Other Asia Pacific | 177 | -10.6% | 0.2% |
| 55 | Other S. & Cent. America | 381 | +68.5% | 0.4% |
| Total World | 93,848 | +4.2% | 100.0% |
Behind America’s considerable lead in oil production, Saudi Arabia (ranked 2nd) produced 12 million B/D, accounting for about 13% of global supply.
Russia came in third with 11 million B/D in 2022. Together, these top three oil producing behemoths, along with Canada (4th) and Iraq (5th), make up more than half of the entire world’s oil supply.
Meanwhile, the top 10 oil producers, including those ranked 6th to 10th—China, UAE, Iran, Brazil, and Kuwait—are responsible for more than 70% of the world’s oil production.
Notably, all top 10 oil giants increased their production between 2021–2022, and as a result, global output rose 4.2% year-on-year.
Major Oil Producing Regions in 2022
The Middle East accounts for one-third of global oil production and North America makes up almost another one-third of production. The Commonwealth of Independent States—an organization of post-Soviet Union countries—is another major regional producer of oil, with a 15% share of world production.
| Region | 2022 Production (Thousand B/D) | YoY Change | Share of World Supply |
|---|---|---|---|
| Middle East | 30,743 | +9.2% | 32.8% |
| North America | 25,290 | +5.3% | 27.0% |
| CIS | 14,006 | +0.9% | 14.9% |
| Africa | 7,043 | -3.5% | 7.5% |
| Asia Pacific | 7,273 | -1.4% | 7.8% |
| South & Central America | 6,361 | 7.2% | 6.8% |
| Europe | 3,131 | -8.6% | 3.3% |
What’s starkly apparent in the data however is Europe’s declining share of oil production, now at 3% of the world’s supply. In the last 20 years the EU’s oil output has dropped by more than 50% due to a variety of factors, including stricter environmental regulations and a shift to natural gas.
Another lens to look at regional production is through OPEC members, which control about 35% of the world’s oil output and about 70% of the world’s oil reserves.
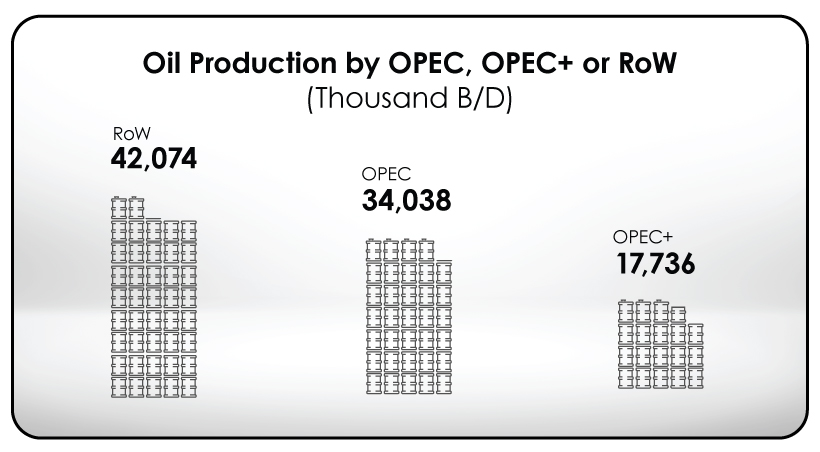
When taking into account the group of 10 oil exporting countries OPEC has relationships with, known as OPEC+, the share of oil production increases to more than half of the world’s supply.
Oil’s Big Balancing Act
Since it’s the very lifeblood of the modern economy, the countries that control significant amounts of oil production also reap immense political and economic benefits. Entire regions have been catapulted into prosperity and wars have been fought over the control of the resource.
At the same time, the ongoing effort to pivot to renewable energy is pushing many major oil exporters to diversify their economies. A notable example is Saudi Arabia, whose sovereign wealth fund has invested in companies like Uber and WeWork.
However, the world still needs oil, as it supplies nearly one-third of global energy demand.


Energy Shift
Visualizing Copper Production by Country in 2023
Chile and Peru account for one-third of the world’s copper output.

Visualizing Copper Production by Country in 2023
This was originally posted on our Voronoi app. Download the app for free on iOS or Android and discover incredible data-driven charts from a variety of trusted sources.
Copper is considered an essential metal for the clean energy transition because it is a great conductor of electricity.
As a result, governments around the world have been encouraging the construction of new mines, and mining companies have been seeking new projects and acquiring existing mines to meet the growing demand.
In this graphic, we illustrate global copper production in 2023, based on data from the U.S. Geological Survey, Mineral Commodity Summaries, as of January 2024.
Most Copper Comes from South America
Chile and Peru account for one-third of the world’s copper output.
| Country | Region | 2023E Production (Million tonnes) |
|---|---|---|
| 🇨🇱 Chile | South America | 5.0 |
| 🇵🇪 Peru | South America | 2.6 |
| 🇨🇩 Congo (Kinshasa) | Africa | 2.5 |
| 🇨🇳 China | Asia | 1.7 |
| 🇺🇸 United States | North America | 1.1 |
| 🇷🇺 Russia | Europe/Asia | 0.9 |
| 🇦🇺 Australia | Oceania | 0.8 |
| 🇮🇩 Indonesia | Asia | 0.8 |
| 🇿🇲 Zambia | Africa | 0.8 |
| 🇲🇽 Mexico | North America | 0.7 |
| 🇰🇿 Kazakhstan | Asia | 0.6 |
| 🇨🇦 Canada | North America | 0.5 |
| 🇵🇱 Poland | Europe | 0.4 |
| 🌍 Rest of World | -- | 3.1 |
| World total (rounded) | -- | 21.5 |
Chile is also home to the two largest mines in the world, Escondida and Collahuasi.
Meanwhile, African countries have rapidly increased their production. The Democratic Republic of Congo, for example, transitioned from being a secondary copper producer in the late 1990s to becoming the third-largest producer by 2023.
Part of the growth in copper mining in Africa is attributed to high investment from China. Chinese mining companies represent 8% of Africa’s total output in the mining sector.
Within its territory, China has also seen a 277% growth in copper production over the last three decades.
In the U.S., Arizona is the leading copper-producing state, accounting for approximately 70% of domestic output. Copper is also mined in Michigan, Missouri, Montana, Nevada, New Mexico, and Utah.
Energy Shift
Who’s Building the Most Solar Energy?
China’s solar capacity triples USA, nearly doubles EU.

Who’s Building the Most Solar Energy?
This was originally posted on our Voronoi app. Download the app for free on iOS or Android and discover incredible data-driven charts from a variety of trusted sources.
In 2023, solar energy accounted for three-quarters of renewable capacity additions worldwide. Most of this growth occurred in Asia, the EU, and the U.S., continuing a trend observed over the past decade.
In this graphic, we illustrate the rise in installed solar photovoltaic (PV) capacity in China, the EU, and the U.S. between 2010 and 2022, measured in gigawatts (GW). Bruegel compiled the data..
Chinese Dominance
As of 2022, China’s total installed capacity stands at 393 GW, nearly double that of the EU’s 205 GW and surpassing the USA’s total of 113 GW by more than threefold in absolute terms.
| Installed solar capacity (GW) | China | EU27 | U.S. |
|---|---|---|---|
| 2022 | 393.0 | 205.5 | 113.0 |
| 2021 | 307.0 | 162.7 | 95.4 |
| 2020 | 254.0 | 136.9 | 76.4 |
| 2019 | 205.0 | 120.1 | 61.6 |
| 2018 | 175.3 | 104.0 | 52.0 |
| 2017 | 130.8 | 96.2 | 43.8 |
| 2016 | 77.8 | 91.5 | 35.4 |
| 2015 | 43.6 | 87.7 | 24.2 |
| 2014 | 28.4 | 83.6 | 18.1 |
| 2013 | 17.8 | 79.7 | 13.3 |
| 2012 | 6.7 | 71.1 | 8.6 |
| 2011 | 3.1 | 53.3 | 5.6 |
| 2010 | 1.0 | 30.6 | 3.4 |
Since 2017, China has shown a compound annual growth rate (CAGR) of approximately 25% in installed PV capacity, while the USA has seen a CAGR of 21%, and the EU of 16%.
Additionally, China dominates the production of solar power components, currently controlling around 80% of the world’s solar panel supply chain.
In 2022, China’s solar industry employed 2.76 million individuals, with manufacturing roles representing approximately 1.8 million and the remaining 918,000 jobs in construction, installation, and operations and maintenance.
The EU industry employed 648,000 individuals, while the U.S. reached 264,000 jobs.
According to the IEA, China accounts for almost 60% of new renewable capacity expected to become operational globally by 2028.
Despite the phasing out of national subsidies in 2020 and 2021, deployment of solar PV in China is accelerating. The country is expected to reach its national 2030 target for wind and solar PV installations in 2024, six years ahead of schedule.

-

 Electrification3 years ago
Ranked: The Top 10 EV Battery Manufacturers
-

 Electrification2 years ago
The Key Minerals in an EV Battery
-

 Real Assets3 years ago
The World’s Top 10 Gold Mining Companies
-

 Electrification2 years ago
Mapped: Solar Power by Country in 2021
-

 Misc3 years ago
All the Metals We Mined in One Visualization
-

 Energy Shift2 years ago
What Are the Five Major Types of Renewable Energy?
-

 Electrification2 years ago
The World’s Largest Nickel Mining Companies
-

 Misc3 years ago
The Largest Copper Mines in the World by Capacity