

Electrification
Visualizing the Range of Electric Cars vs. Gas-Powered Cars
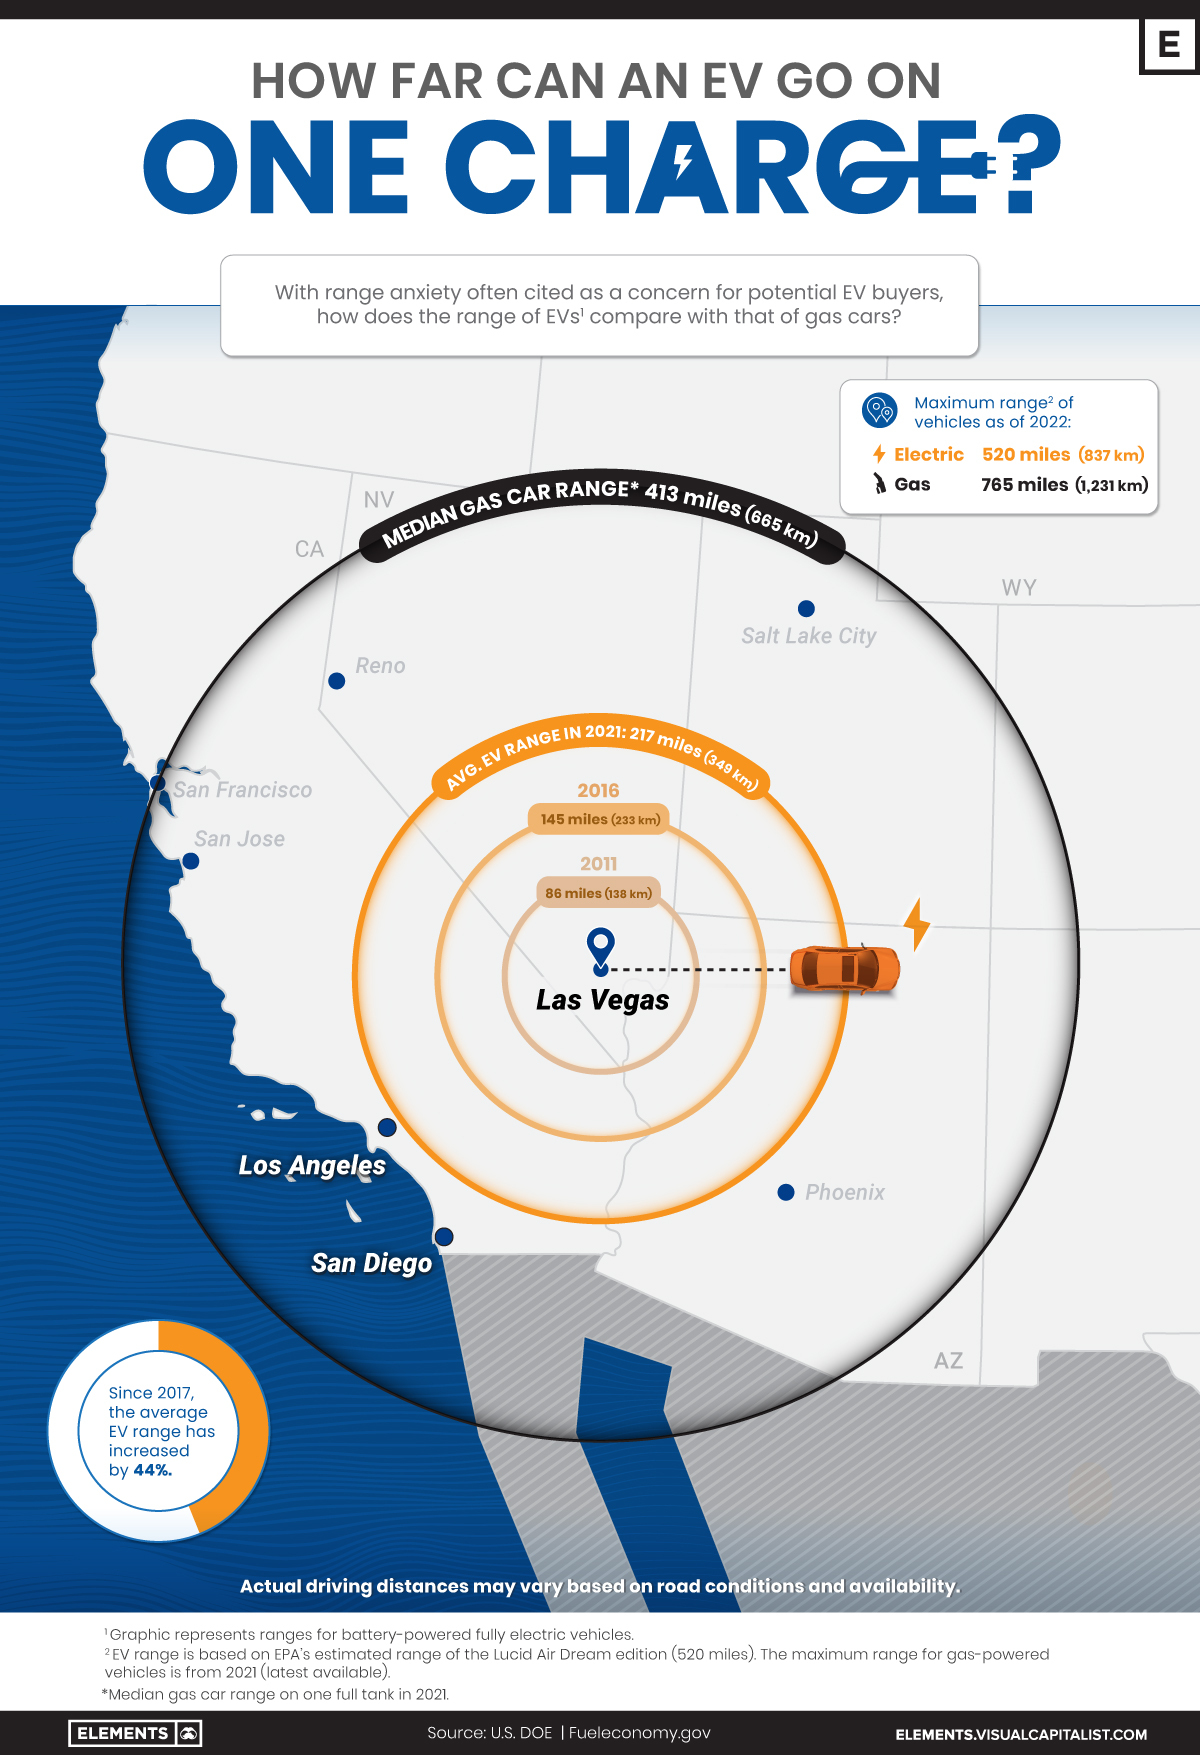
The Range of Electric Cars vs. Gas-Powered Cars
EV adoption has grown rapidly in recent years, but many prospective buyers still have doubts about electric car ranges.
In fact, 33% of new car buyers chose range anxiety—the concern about how far an EV can drive on a full charge—as their top inhibitor to purchasing electric cars in a survey conducted by EY.
So, how far can the average electric car go on one charge, and how does that compare with the typical range of gas-powered cars?
The Rise in EV Ranges
Thanks to improvements in battery technology, the average range of electric cars has more than doubled over the last decade, according to data from the International Energy Agency (IEA).
| Year | Avg. EV Range | Maximum EV Range |
|---|---|---|
| 2010 | 79 miles (127 km) | N/A |
| 2011 | 86 miles (138 km) | 94 miles (151 km) |
| 2012 | 99 miles (159 km) | 265 miles (426 km) |
| 2013 | 117 miles (188 km) | 265 miles (426 km) |
| 2014 | 130 miles (209 km) | 265 miles (426 km) |
| 2015 | 131 miles (211 km) | 270 miles (435 km) |
| 2016 | 145 miles (233 km) | 315 miles (507 km) |
| 2017 | 151 miles (243 km) | 335 miles (539 km) |
| 2018 | 189 miles (304 km) | 335 miles (539 km) |
| 2019 | 209 miles (336 km) | 370 miles (595 km) |
| 2020 | 210 miles (338 km) | 402 miles (647 km) |
| 2021 | 217 miles (349 km) | 520 miles* (837 km) |
*Max range for EVs offered in the United States.
Source: IEA, U.S. DOE
As of 2021, the average battery-powered EV could travel 217 miles (349 km) on a single charge. It represents a 44% increase from 151 miles (243 km) in 2017 and a 152% increase relative to a decade ago.
Despite the steady growth, EVs still fall short when compared to gas-powered cars. For example, in 2021, the median gas car range (on one full tank) in the U.S. was around 413 miles (664 km)—nearly double what the average EV would cover.
As automakers roll out new models, electric car ranges are likely to continue increasing and could soon match those of their gas-powered counterparts. It’s important to note that EV ranges can change depending on external conditions.
What Affects EV Ranges?
In theory, EV ranges depend on battery capacity and motor efficiency, but real-world results can vary based on several factors:
- Weather: At temperatures below 20℉ (-6.7℃), EVs can lose around 12% of their range, rising to 41% if heating is turned on inside the vehicle.
- Operating Conditions: Thanks to regenerative braking, EVs may extend their maximum range during city driving.
- Speed: When driving at high speeds, EV motors spin faster at a less efficient rate. This may result in range loss.
On the contrary, when driven at optimal temperatures of about 70℉ (21.5℃), EVs can exceed their rated range, according to an analysis by Geotab.
The 10 Longest-Range Electric Cars in America
Here are the 10 longest-range electric cars available in the U.S. as of 2022, based on Environmental Protection Agency (EPA) range estimates:
| Car | Range On One Full Charge | Estimated Base Price |
|---|---|---|
| Lucid Air | 520 miles (837 km) | $170,500 |
| Tesla Model S | 405 miles (652 km) | $106,190 |
| Tesla Model 3 | 358 miles (576 km) | $59,440 |
| Mercedes EQS | 350 miles (563 km) | $103,360 |
| Tesla Model X | 348 miles (560 km) | $122,440 |
| Tesla Model Y | 330 miles (531 km) | $67,440 |
| Hummer EV | 329 miles (529 km) | $110,295 |
| BMW iX | 324 miles (521 km) | $84,195 |
| Ford F-150 Lightning | 320 miles (515 km) | $74,169 |
| Rivian R1S | 316 miles (509 km) | $70,000 |
Source: Car and Driver
The top-spec Lucid Air offers the highest range of any EV with a price tag of $170,500, followed by the Tesla Model S. But the Tesla Model 3 offers the most bang for your buck if range and price are the only two factors in consideration.


Electrification
Ranked: The Top 10 EV Battery Manufacturers in 2023
Asia dominates this ranking of the world’s largest EV battery manufacturers in 2023.

The Top 10 EV Battery Manufacturers in 2023
This was originally posted on our Voronoi app. Download the app for free on iOS or Android and discover incredible data-driven charts from a variety of trusted sources.
Despite efforts from the U.S. and EU to secure local domestic supply, all major EV battery manufacturers remain based in Asia.
In this graphic we rank the top 10 EV battery manufacturers by total battery deployment (measured in megawatt-hours) in 2023. The data is from EV Volumes.
Chinese Dominance
Contemporary Amperex Technology Co. Limited (CATL) has swiftly risen in less than a decade to claim the title of the largest global battery group.
The Chinese company now has a 34% share of the market and supplies batteries to a range of made-in-China vehicles, including the Tesla Model Y, SAIC’s MG4/Mulan, and Li Auto models.
| Company | Country | 2023 Production (megawatt-hour) | Share of Total Production |
|---|---|---|---|
| CATL | 🇨🇳China | 242,700 | 34% |
| BYD | 🇨🇳China | 115,917 | 16% |
| LG Energy Solution | 🇰🇷Korea | 108,487 | 15% |
| Panasonic | 🇯🇵Japan | 56,560 | 8% |
| SK On | 🇰🇷Korea | 40,711 | 6% |
| Samsung SDI | 🇰🇷Korea | 35,703 | 5% |
| CALB | 🇨🇳China | 23,493 | 3% |
| Farasis Energy | 🇨🇳China | 16,527 | 2% |
| Envision AESC | 🇨🇳China | 8,342 | 1% |
| Sunwoda | 🇨🇳China | 6,979 | 1% |
| Other | - | 56,040 | 8% |
In 2023, BYD surpassed LG Energy Solution to claim second place. This was driven by demand from its own models and growth in third-party deals, including providing batteries for the made-in-Germany Tesla Model Y, Toyota bZ3, Changan UNI-V, Venucia V-Online, as well as several Haval and FAW models.
The top three battery makers (CATL, BYD, LG) collectively account for two-thirds (66%) of total battery deployment.
Once a leader in the EV battery business, Panasonic now holds the fourth position with an 8% market share, down from 9% last year. With its main client, Tesla, now effectively sourcing batteries from multiple suppliers, the Japanese battery maker seems to be losing its competitive edge in the industry.
Overall, the global EV battery market size is projected to grow from $49 billion in 2022 to $98 billion by 2029, according to Fortune Business Insights.
Electrification
White Gold: Mapping U.S. Lithium Mines
In this graphic, Visual Capitalist partnerered with EnergyX to explore the size and location of U.S. lithium mines.

White Gold: Mapping U.S. Lithium Mines
The U.S. doubled imports of lithium-ion batteries for the third consecutive year in 2022, and with EV demand growing yearly, U.S. lithium mines must ramp up production or rely on other nations for their supply of refined lithium.
To determine if the domestic U.S. lithium opportunity can meet demand, we partnered with EnergyX to determine how much lithium sits within U.S. borders.
U.S. Lithium Projects
The most crucial measure of a lithium mine’s potential is the quantity that can be extracted from the source.
For each lithium resource, the potential volume of lithium carbonate equivalent (LCE) was calculated with a ratio of one metric ton of lithium producing 5.32 metric tons of LCE. Cumulatively, existing U.S. lithium projects contain 94.8 million metric tons of LCE.
| Rank | Project Name | LCE, million metric tons (est.) |
|---|---|---|
| 1 | McDermitt Caldera | 21.5 |
| 2 | Thacker Pass | 19.1 |
| 3 | Tonopah Flats | 18.0 |
| 4 | TLC Lithium | 10.7 |
| 5 | Clayton Valley (Century Lithium) | 6.3 |
| 6 | Zeus Lithium | 6.3 |
| 7 | Rhyolite Ridge | 3.4 |
| 8 | Arkansas Smackover (Phase 1A) | 2.8 |
| 9 | Basin Project | 2.2 |
| 10 | McGee Deposit | 2.1 |
| 11 | Arkansas Smackover (South West) | 1.8 |
| 12 | Clayton Valley (Lithium-X, Pure Energy) | 0.8 |
| 13 | Big Sandy | 0.3 |
| 14 | Imperial Valley/Salton Sea | 0.3 |
U.S. Lithium Opportunities, By State
U.S. lithium projects mainly exist in western states, with comparatively minor opportunities in central or eastern states.
| State | LCE, million metric tons (est.) |
|---|---|
| Nevada | 88.2 |
| Arkansas | 4.6 |
| Arizona | 2.5 |
| California | 0.3 |
Currently, the U.S. is sitting on a wealth of lithium that it is underutilizing. For context, in 2022, the U.S. only produced about 5,000 metric tons of LCE and imported a projected 19,000 metric tons of LCE, showing that the demand for the mineral is healthy.
The Next Gold Rush?
U.S. lithium companies have the opportunity to become global leaders in lithium production and accelerate the transition to sustainable energy sources. This is particularly important as the demand for lithium is increasing every year.
EnergyX is on a mission to meet U.S. lithium demands using groundbreaking technology that can extract 300% more lithium from a source than traditional methods.
You can take advantage of this opportunity by investing in EnergyX and joining other significant players like GM in becoming a shareholder.


-

 Electrification3 years ago
Ranked: The Top 10 EV Battery Manufacturers
-

 Electrification2 years ago
The Key Minerals in an EV Battery
-

 Real Assets3 years ago
The World’s Top 10 Gold Mining Companies
-

 Misc3 years ago
All the Metals We Mined in One Visualization
-

 Electrification3 years ago
The Biggest Mining Companies in the World in 2021
-

 Energy Shift2 years ago
What Are the Five Major Types of Renewable Energy?
-

 Electrification2 years ago
Mapped: Solar Power by Country in 2021
-

 Electrification2 years ago
The World’s Largest Nickel Mining Companies