

Urbanization
Breaking the Ice: Mapping a Changing Arctic
Breaking the Ice: Mapping a Changing Arctic
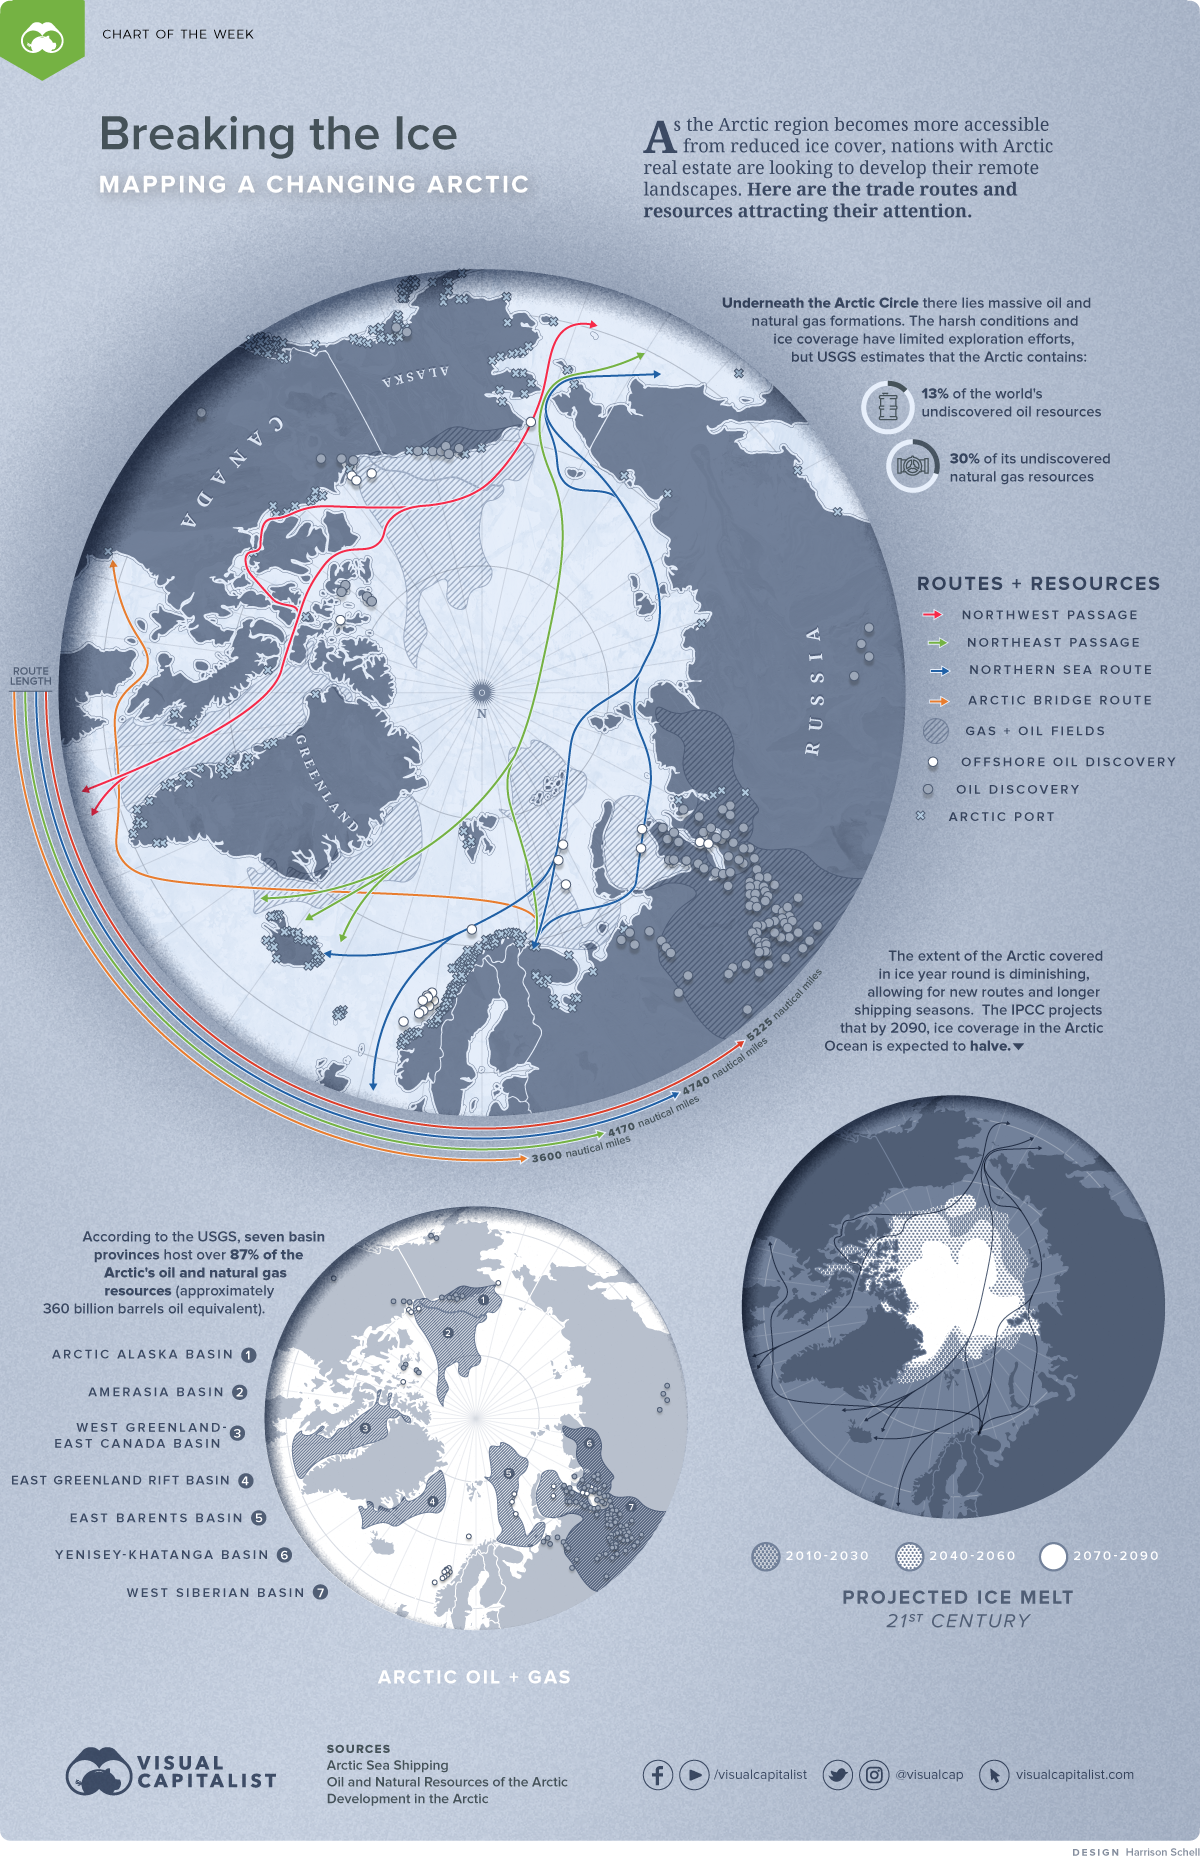
The Arctic is changing. As retreating ice cover makes this region more accessible, nations with Arctic real estate are thinking of developing these subzero landscapes and the resources below.
As the Arctic evolves, a vast amount of resources will become more accessible and longer shipping seasons will improve Arctic logistics. But with a changing climate and increased public pressure to limit resource development in environmentally sensitive regions, the future of northern economic activity is far from certain.
This week’s Chart of the Week shows the location of major oil and gas fields in the Arctic and the possible new trade routes through this frontier.
A Final Frontier for Undiscovered Resources?
Underneath the Arctic Circle lies massive oil and natural gas formations. The United States Geological Survey estimates that the Arctic contains approximately 13% of the world’s undiscovered oil resources and about 30% of its undiscovered natural gas resources.
So far, most exploration in the Arctic has occurred on land. This work produced the Prudhoe Bay Oil Field in Alaska, the Tazovskoye Field in Russia, and hundreds of smaller fields, many of which are on Alaska’s North Slope, an area now under environmental protection.
Land accounts for about 1/3 of the Arctic’s area and is thought to hold about 16% of the Arctic’s remaining undiscovered oil and gas resources. A further 1/3 of the Arctic area is comprised of offshore continental shelves, which are thought to contain enormous amounts of resources but remain largely unexplored by geologists.
The remaining 1/3 of the Arctic is deep ocean waters measuring thousands of feet in depth.
The Arctic circle is about the same geographic size as the African continent─about 6% of Earth’s surface area─yet it holds an estimated 22% of Earth’s oil and natural gas resources. This paints a target on the Arctic for exploration and development, especially with shorter seasons of ice coverage improving ocean access.
Thawing Ice Cover: Improved Ocean Access, New Trading Routes
As Arctic ice melts, sea routes will stay navigable for longer periods, which could drastically change international trade and shipping. September ice coverage has decreased by more than 25% since 1979, although the area within the Arctic Circle is still almost entirely covered with ice from November to July.
| Route | Length | Ice-free Time |
|---|---|---|
| Northern Sea Route | 4,740 Nautical Miles | 6 weeks of open waters |
| Transpolar Sea Route | 4,179 Nautical Miles | 2 weeks of open waters |
| Northwest Passage | 5,225 Nautical Miles | Periodically ice-free |
| Arctic Bridge | 3,600 Nautical Miles | Ice-free |
Typically shipping to Japan from Rotterdam would use the Suez Canal and take about 30 days, whereas a route from New York would use the Panama Canal and take about 25 days.
But if the Europe-Asia trip used the Northern Sea Route along the northern coast of Russia, the trip would last 18 days and the distance would shrink from ~11,500 nautical miles to ~6,900 nautical miles. For the U.S.-Asia trip through the Northwest Passage, it would take 21 days, rather than 25.
Control of these routes could bring significant advantages to countries and corporations looking for a competitive edge.
Competing Interests: Arctic Neighbors
Eight countries lay claim to land that lies within the Arctic Circle: Canada, Denmark (through its administration of Greenland), Finland, Iceland, Norway, Russia, Sweden, and the United States.
There is no consistent agreement among these nations regarding the claims to oil and gas beneath the Arctic Ocean seafloor. However, the United Nations Convention on the Law of the Sea provides each country an exclusive economic zone extending 200 miles out from its shoreline and up to 350 miles, under certain geological conditions.
Uncertain geology and politics has led to overlapping territorial disputes over how each nation defines and maps its claims based on the edge of continental margins. For example, Russia claims that their continental margin follows the Lomonosov Ridge all the way to the North Pole. In another, both the U.S. and Canada claim a portion of the Beaufort Sea, which is thought to contain significant oil and natural gas resources.
To Develop or Not to Develop
Just because the resources are there does not mean humans have to exploit them, especially given oil’s environmental impacts. Canada’s federal government has already returned security deposits that oil majors had paid to drill in Canadian Arctic waters, which are currently off limits until at least 2021.
In total, the Government of Canada returned US$327 million worth of security deposits, or 25% of the money oil companies pledged to spend on exploration in the Beaufort Sea. In addition, Goldman Sachs announced that it would not finance any projects in the U.S.’s Arctic National Wildlife Refuge.
The retreat of Western economic interests in the Arctic may leave the region to Russia and China, countries with less strict environmental regulations.
Russia has launched an ambitious plan to remilitarize the Arctic. Specifically, Russia is searching for evidence to prove its territorial claims to additional portions of the Arctic, so that it can move its Arctic borderline — which currently measures over 14,000 miles in length — further north.
In a changing Arctic, this potentially resource-rich region could become another venue for geopolitical tensions, again testing whether humans can be proper stewards of the natural world.


Urbanization
Ranked: The 20 Most Air-Polluted Cities on Earth
Using 2022 average PM2.5 concentrations, we rank the most polluted cities in the world.


Ranked: The 20 Most Air-Polluted Cities on Earth
According to the World Health Organization (WHO), almost the entire global population (99%) breathes air that exceeds WHO air quality limits.
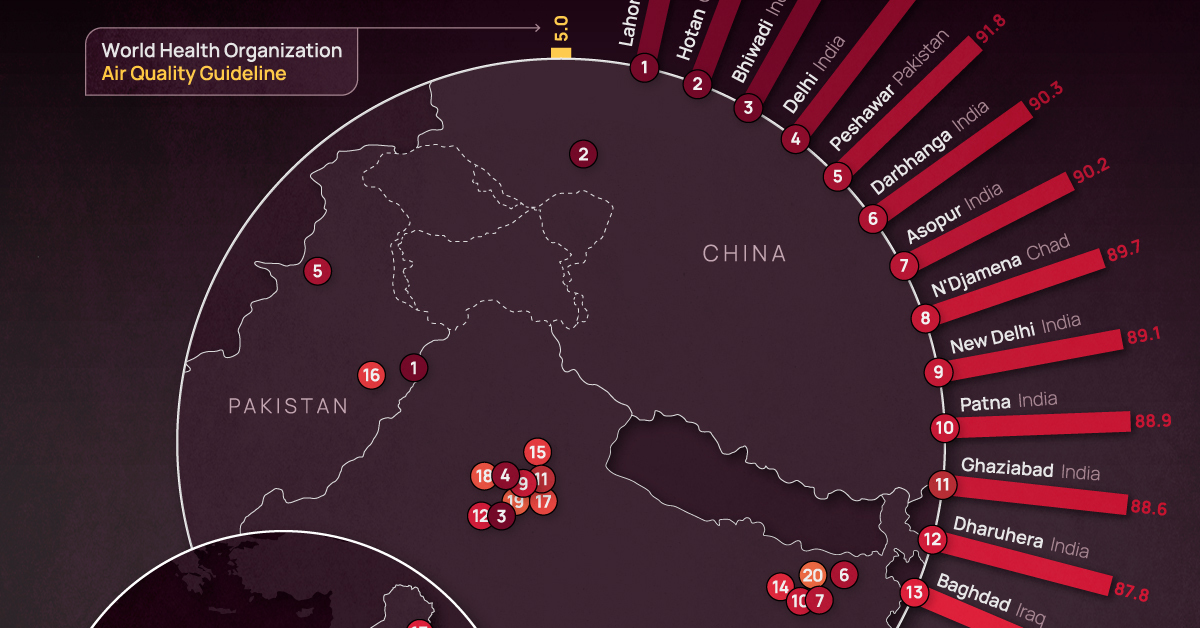
In the above map, we use 2022 average PM2.5 concentrations from IQAir’s World Air Quality Report to visualize the most air-polluted major cities in the world.
World’s Air Pollution Hot Spots
As one of the standard air quality indicators used by the WHO, the PM2.5 concentration refers to the quantity of fine particulate matter with a diameter of 2.5 micrometers or less in a given volume of air.
Fine particulate matter that is this small can penetrate the lungs when inhaled and enter the bloodstream, affecting all major organs.
Based on annual average PM2.5 concentrations (μg/m³) in 2022, here are the most polluted cities in the world.
| Rank | City | 2022 average PM2.5 concentration (μg/m³) |
|---|---|---|
| 1 | 🇵🇰 Lahore, Pakistan | 97.4 |
| 2 | 🇨🇳 Hotan, China | 94.3 |
| 3 | 🇮🇳 Bhiwadi, India | 92.7 |
| 4 | 🇮🇳 Delhi, India | 92.6 |
| 5 | 🇵🇰 Peshawar, Pakistan | 91.8 |
| 6 | 🇮🇳 Darbhanga, India | 90.3 |
| 7 | 🇮🇳 Asopur, India | 90.2 |
| 8 | 🇹🇩 N'Djamena, Chad | 89.7 |
| 9 | 🇮🇳 New Delhi, India | 89.1 |
| 10 | 🇮🇳 Patna, India | 88.9 |
| 11 | 🇮🇳 Ghaziabad, India | 88.6 |
| 12 | 🇮🇳 Dharuhera, India | 87.8 |
| 13 | 🇮🇶 Baghdad, Iraq | 86.7 |
| 14 | 🇮🇳 Chapra, India | 85.9 |
| 15 | 🇮🇳 Muzaffarnagar, India | 85.5 |
| 16 | 🇵🇰 Faisalabad, Pakistan | 84.5 |
| 17 | 🇮🇳 Greater Noida, India | 83.2 |
| 18 | 🇮🇳 Bahadurgarh, India | 82.2 |
| 19 | 🇮🇳 Faridabad, India | 79.7 |
| 20 | 🇮🇳 Muzaffarpur, India | 79.2 |
With numbers these high, the concentration of some or all of the following pollutants are at dangerous levels in these cities:
- Ground-level ozone
- Particulate matter
- Carbon monoxide
- Sulfur dioxide
- Nitrogen dioxide
At the top of the list, Lahore in Pakistan has a combination of high vehicle and industrial emissions, as well as smoke from brick kilns, crop residue, general waste burning, and dust from construction sites.
Air pollution levels can also be impacted by practices such as large-scale tree removal in order to build new roads and buildings.
As a result of its growing population and rapidly expanding industrial sector, India has 14 cities on the list, outpacing China, formerly considered the world’s number one air pollution source.
The only African country on the list, Chad, experienced severe dust storms in 2022 that resulted in an 18% increase in PM2.5 concentration in 2022 compared to the previous year.
The Cost of Poor Air Quality
Poor air quality is one of the leading causes of early deaths worldwide, just behind high blood pressure, tobacco use, and poor diet.
According to a 2020 study by the Health Effects Institute, 6.67 million people died as a result of air pollution in 2019.
In addition to the millions of premature deaths each year, the global cost of health damages associated with air pollution currently sits at $8.1 trillion.
Urbanization
Visualizing the World’s Largest Steel-Producing Countries
China has dominated global steel production the past few decades, but how did the country get here, and is its production growth over?
The Largest Steel-Producing Countries: Visualized
Steel is a critical component of modern industry and economy, essential for the construction of buildings, automobiles, and many other appliances and infrastructure used in our daily lives.
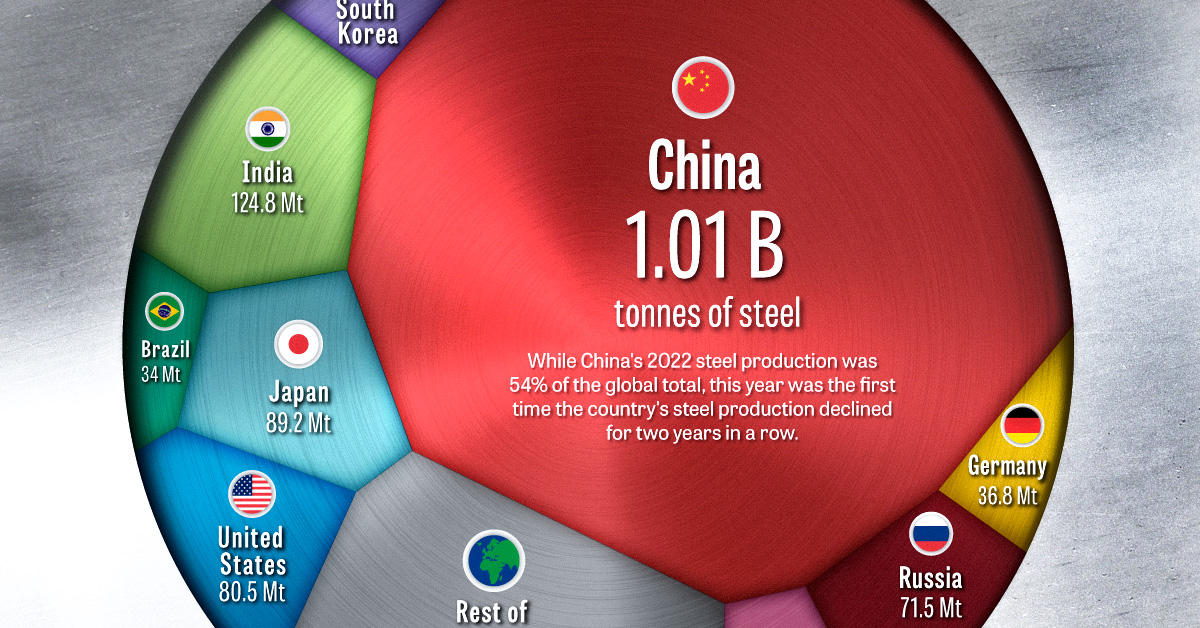
This graphic uses data from the World Steel Association to visualize the world’s top steel-producing countries, and highlights China’s ascent to the top, as it now makes up more than half of the world’s steel production.
The State of Global Steel Production
Global steel production in 2022 reached 1,878 million tonnes, barely surpassing the pre-pandemic production of 1,875 million tonnes in 2019.
| Country | 2022 Production (in million tonnes) | Annual Production Change | Global Share |
|---|---|---|---|
| 🇨🇳 China | 1013.0 | -2.0% | 53.9% |
| 🇮🇳 India | 124.8 | 5.3% | 6.6% |
| 🇯🇵 Japan | 89.2 | -7.9% | 4.8% |
| 🇺🇸 United States | 80.5 | -6.5% | 4.3% |
| 🇷🇺 Russia | 71.5 | -5.8% | 3.8% |
| 🇰🇷 South Korea | 65.9 | -6.9% | 3.5% |
| 🇩🇪 Germany | 36.8 | -8.8% | 2.0% |
| 🇹🇷 Türkiye | 35.1 | -15.0% | 1.9% |
| 🇧🇷 Brazil | 34.0 | -6.5% | 1.8% |
| 🇮🇷 Iran | 30.6 | 6.8% | 1.6% |
| 🇮🇹 Italy | 21.6 | -13.0% | 1.1% |
| 🇹🇼 Taiwan | 20.7 | -12.1% | 1.1% |
| 🇻🇳 Vietnam | 20.0 | -15.0% | 1.1% |
| 🇲🇽 Mexico | 18.2 | -1.9% | 1.0% |
| 🇮🇩 Indonesia | 15.6 | 8.3% | 0.8% |
| Rest of World | 201.0 | -11.2% | 10.7% |
| World Total | 1878.5 | -3.9% | 100.0% |
2022’s steel production marked a significant reduction compared to the post-pandemic rebound of 1,960 million tonnes in 2021, with a year-over-year decline of 4.2%–the largest drop since 2009, and prior to that, 1991.
This decline was spread across many of the world’s top steel producers, with only three of the top fifteen countries, India, Iran, and Indonesia, increasing their yearly production. Most of the other top steel-producing countries saw annual production declines of more than 5%, with Turkey, Italy, Taiwan, and Vietnam’s production all declining by double digits.
Even the world’s top steel-producing nation, China, experienced a modest 2% decline, which due to the country’s large production amounted to a decline of 19.8 million tonnes, more than many other nations produce in a year.
Despite India, the world’s second-largest steel producer, increasing its production by 5.3%, the country’s output still amounts to just over one-tenth of the steel produced by China.
China’s Meteoric Rise in Steel Production
Although China dominates the world’s steel production with more than a 54% share today, this hasn’t always been the case.
In 1967, the World Steel Association’s first recorded year of steel production figures, China only produced an estimated 14 million tonnes, making up barely 3% of global output. At that time, the U.S. and the USSR were competing as the world’s top steel producers at 115 and 102 million tonnes respectively, followed by Japan at 62 million tonnes.
Almost three decades later in 1996, China had successively overtaken Russia, the U.S., and Japan to become the top steel-producing nation with 101 million tonnes of steel produced that year.
The early 2000s marked a period of rapid growth for China, with consistent double-digit percentage increases in steel production each year.
The Recent Decline in China’s Steel Production
Since the early 2000s, China’s average annual growth in steel production has slowed to 3.4% over the last decade (2013-2022), a considerable decline compared to the previous decade’s (2003-2012) 15.2% average annual growth rate.
The past couple of years have seen China’s steel production decline, with 2021 and 2022 marking the first time the country’s production fell for two consecutive years in a row.
While it’s unlikely China will relinquish its position as the top steel-producing nation anytime soon, it remains to be seen whether this recent decline marks the beginning of a new trend or just a brief deviation from the country’s consistent production growth.

-

 Electrification3 years ago
Ranked: The Top 10 EV Battery Manufacturers
-

 Electrification2 years ago
The Key Minerals in an EV Battery
-

 Real Assets3 years ago
The World’s Top 10 Gold Mining Companies
-

 Misc3 years ago
All the Metals We Mined in One Visualization
-

 Electrification3 years ago
The Biggest Mining Companies in the World in 2021
-

 Energy Shift2 years ago
What Are the Five Major Types of Renewable Energy?
-

 Electrification2 years ago
Mapped: Solar Power by Country in 2021
-

 Electrification2 years ago
The World’s Largest Nickel Mining Companies